OCEANS™ METHODOLOGY
Understand the quality and source of every carbon-data result
Make missing information, estimates, source records, calculation lineage, ownership and review status visible throughout the carbon-accounting process.
Because credible reporting requires more than a final number.
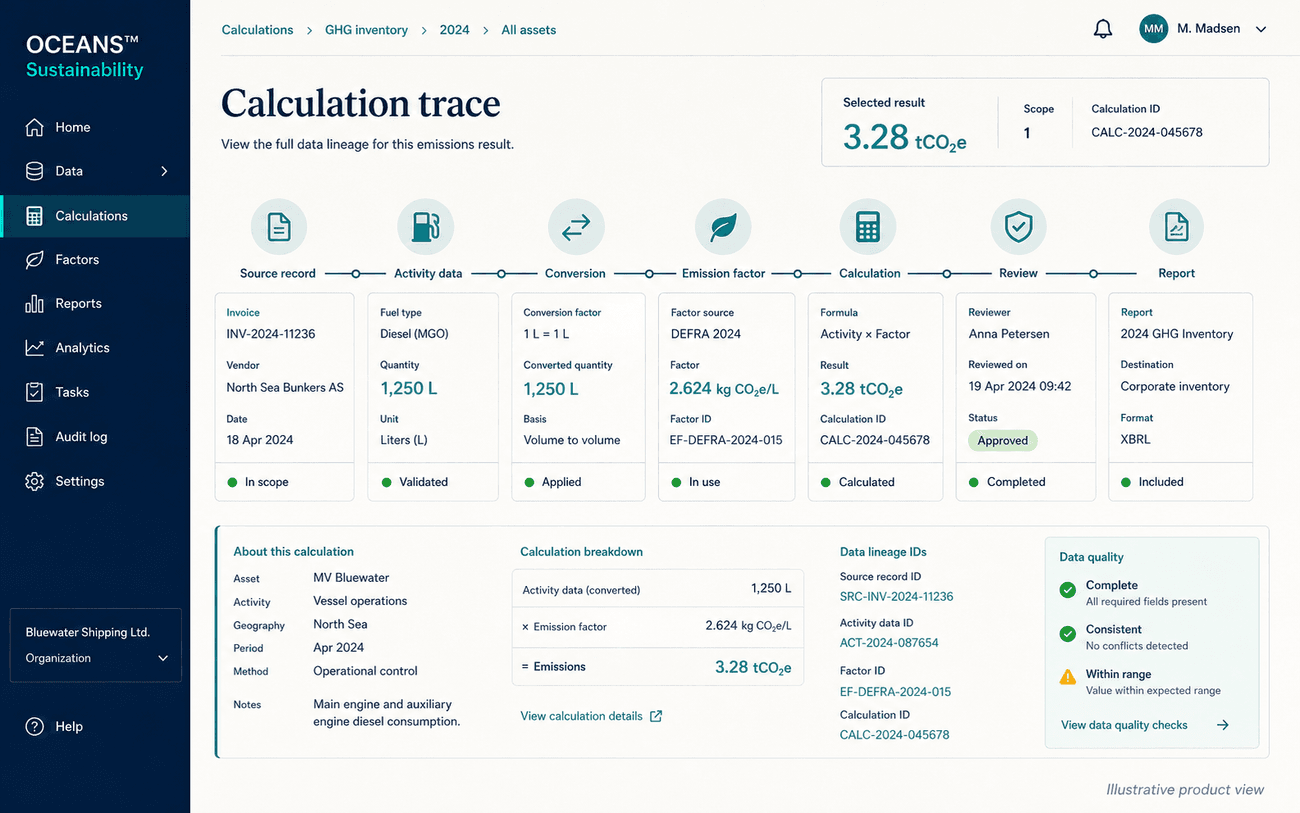
- Source record
- Activity data
- Conversion
- Emission factor
- Calculation
- Review
- Report
On this page
Better reporting begins with better visibility into the data
Sustainability information is often collected from multiple teams, suppliers, systems, spreadsheets, and documents. Not every record has the same completeness or reliability — some values are directly measured, while others depend on secondary data, estimates, or assumptions. OCEANS™ Sustainability helps teams understand these differences instead of presenting every result as equally certain.
Missing context
Information arrives without enough detail to know what it represents.
- Missing source records
- Incomplete supplier information
- Unexplained estimates
Inconsistent processing
The same kind of information is collected or calculated differently across teams and periods.
- Inconsistent units
- Duplicate submissions
- Incorrect reporting periods
- Outdated emission factors
Disconnected evidence
A result exists without a visible path back to what produced it.
- Hidden spreadsheet formulas
- Undocumented methodological changes
- Reported results disconnected from evidence
OUR APPROACH
Evaluate data in the context of its intended use
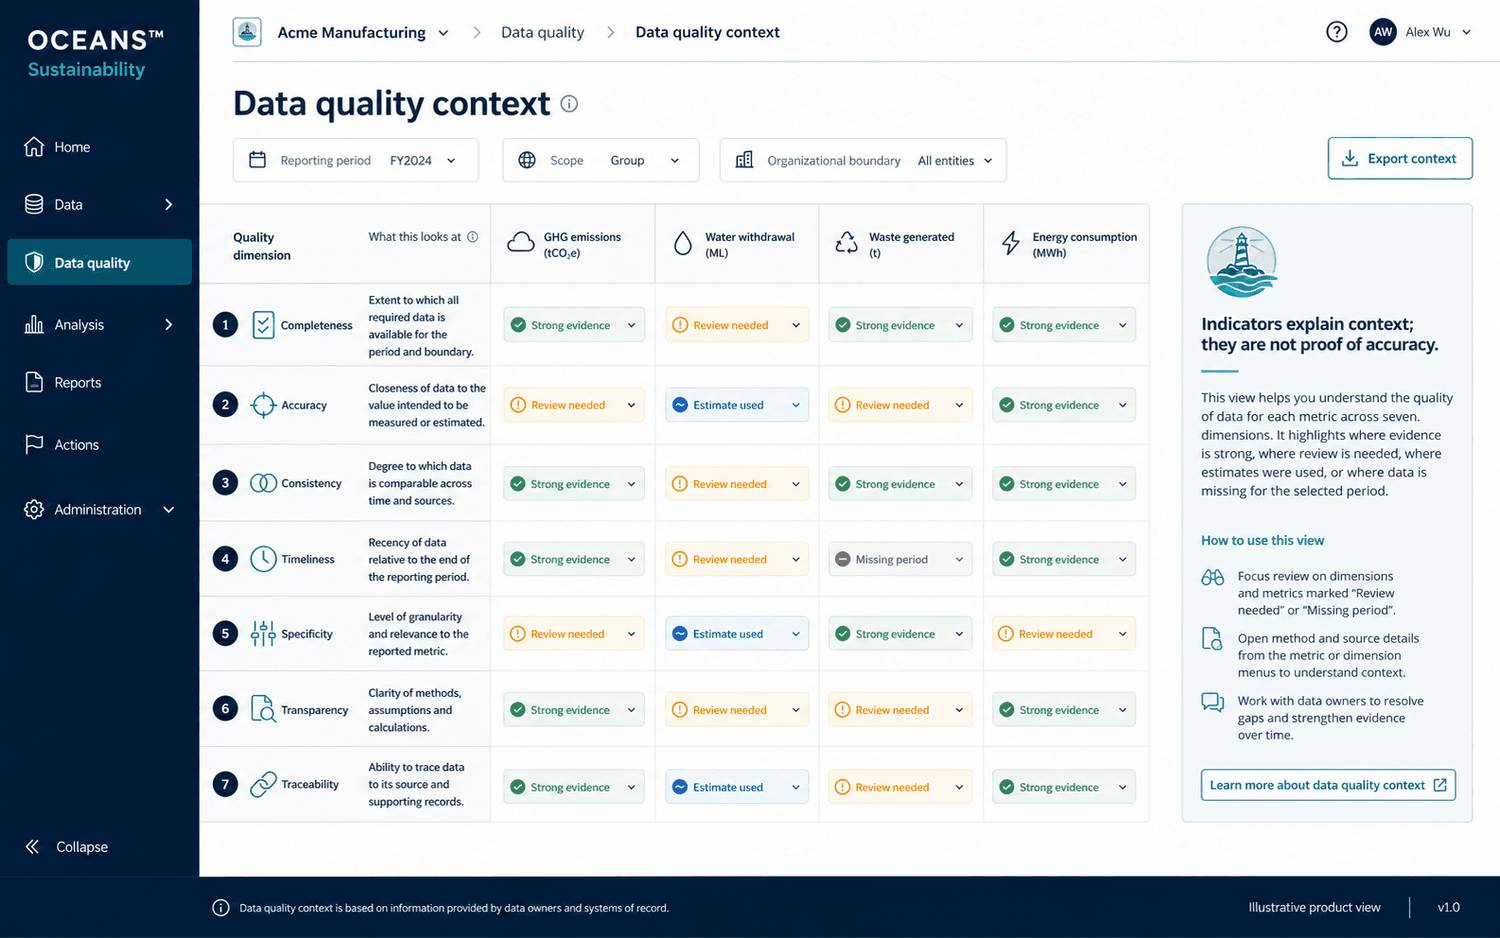
- Completeness
- Is the information required for the calculation present?
- Accuracy
- Does the information reasonably represent the activity being calculated?
- Consistency
- Has the data been collected and calculated using comparable methods across entities and periods?
- Timeliness
- Does the information correspond to the relevant reporting period?
- Specificity
- Does it reflect the relevant supplier, facility, geography, technology, or activity?
- Transparency
- Are sources, methods, assumptions, estimates, and limitations documented?
- Traceability
- Can the reported result be followed back to its underlying records and decisions?
A dataset may be strong in one dimension and limited in another. Indicators explain context; they are not proof of accuracy.
QUALITY CONTEXT
Show where confidence is stronger — and where work remains
A robust process considers criteria such as:
An indicator should explain its component criteria. OCEANS™ Sustainability avoids presenting a single universal score that implies more certainty than the underlying assessment supports.
Preserve the complete path from source to disclosure
For each reported result, OCEANS™ Sustainability is designed to maintain a traceable relationship across seven stages. Open a stage to see the context it carries — every stage is readable in order, with or without JavaScript.
Source record
The original invoice, meter record, procurement export, travel statement, supplier file, or other supporting document.
Activity data
The quantity, spend, distance, mass, energy use, or other business information used.
Transformation
Any cleaning, mapping, aggregation, allocation, or unit conversion performed.
Emission factor
The factor source, version, geography, year, unit, and boundary.
Calculation
The formula and methodology used to produce the emissions result.
Review
The contributor, reviewer, comments, corrections, and approval status.
Reporting output
The dashboard, inventory, questionnaire, or disclosure in which the result appears.
OCEANS™ helps users move from "trust this number" to "follow how this number was produced."
SOURCE INTEGRITY
Keep the original record connected to the calculation
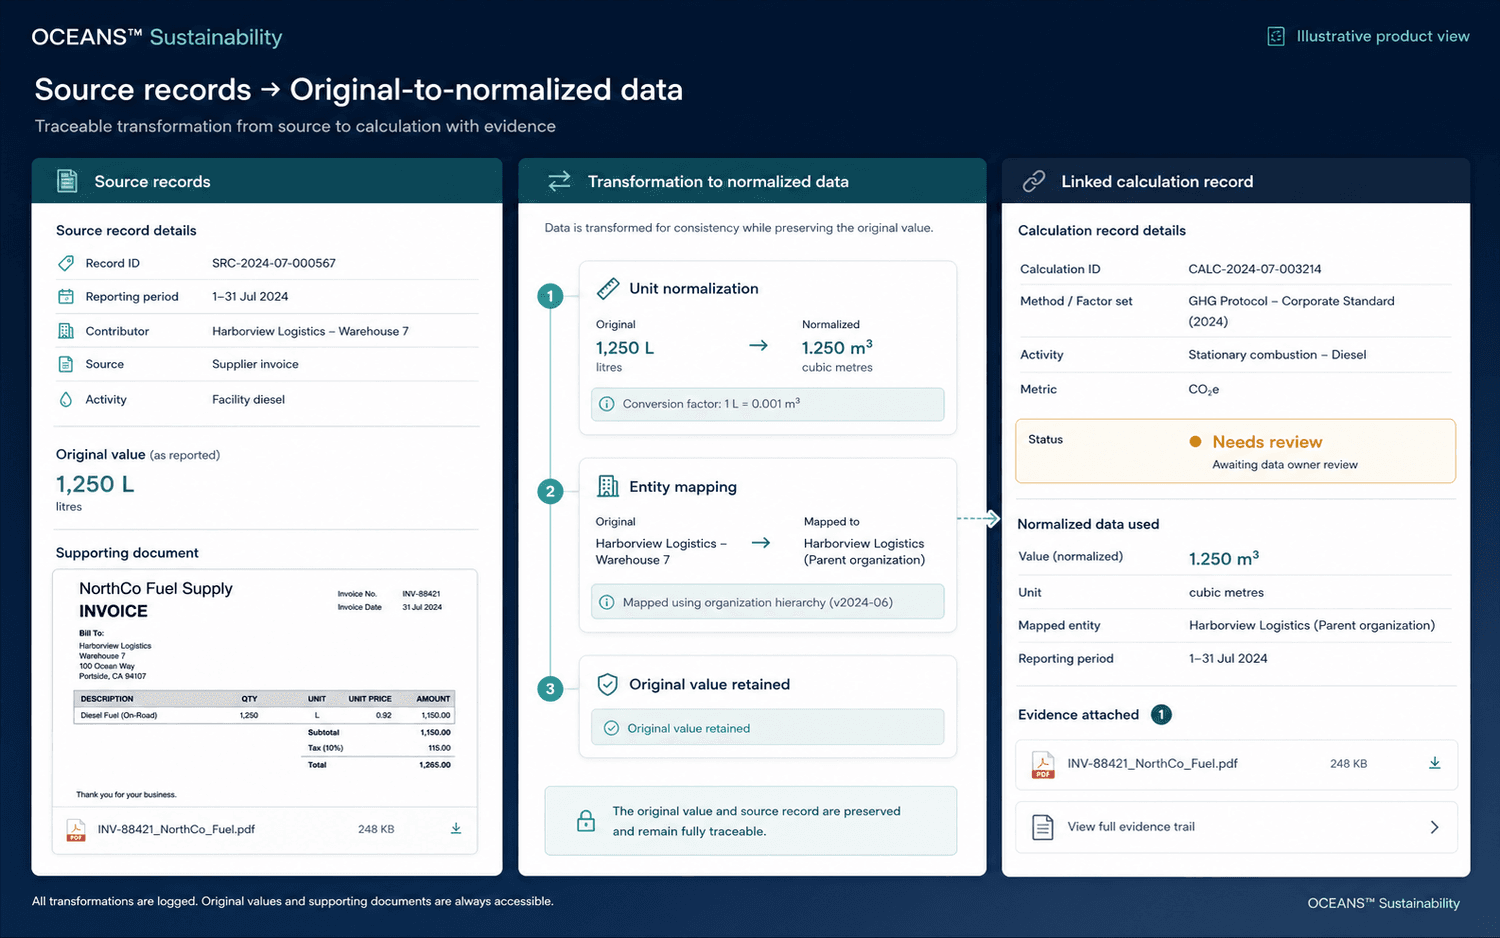
A structured emissions calculation should preserve enough information to understand the original business activity. OCEANS™ Sustainability is designed to retain:
Where data are transformed, the original value should remain recoverable.
Distinguish measured information from estimates
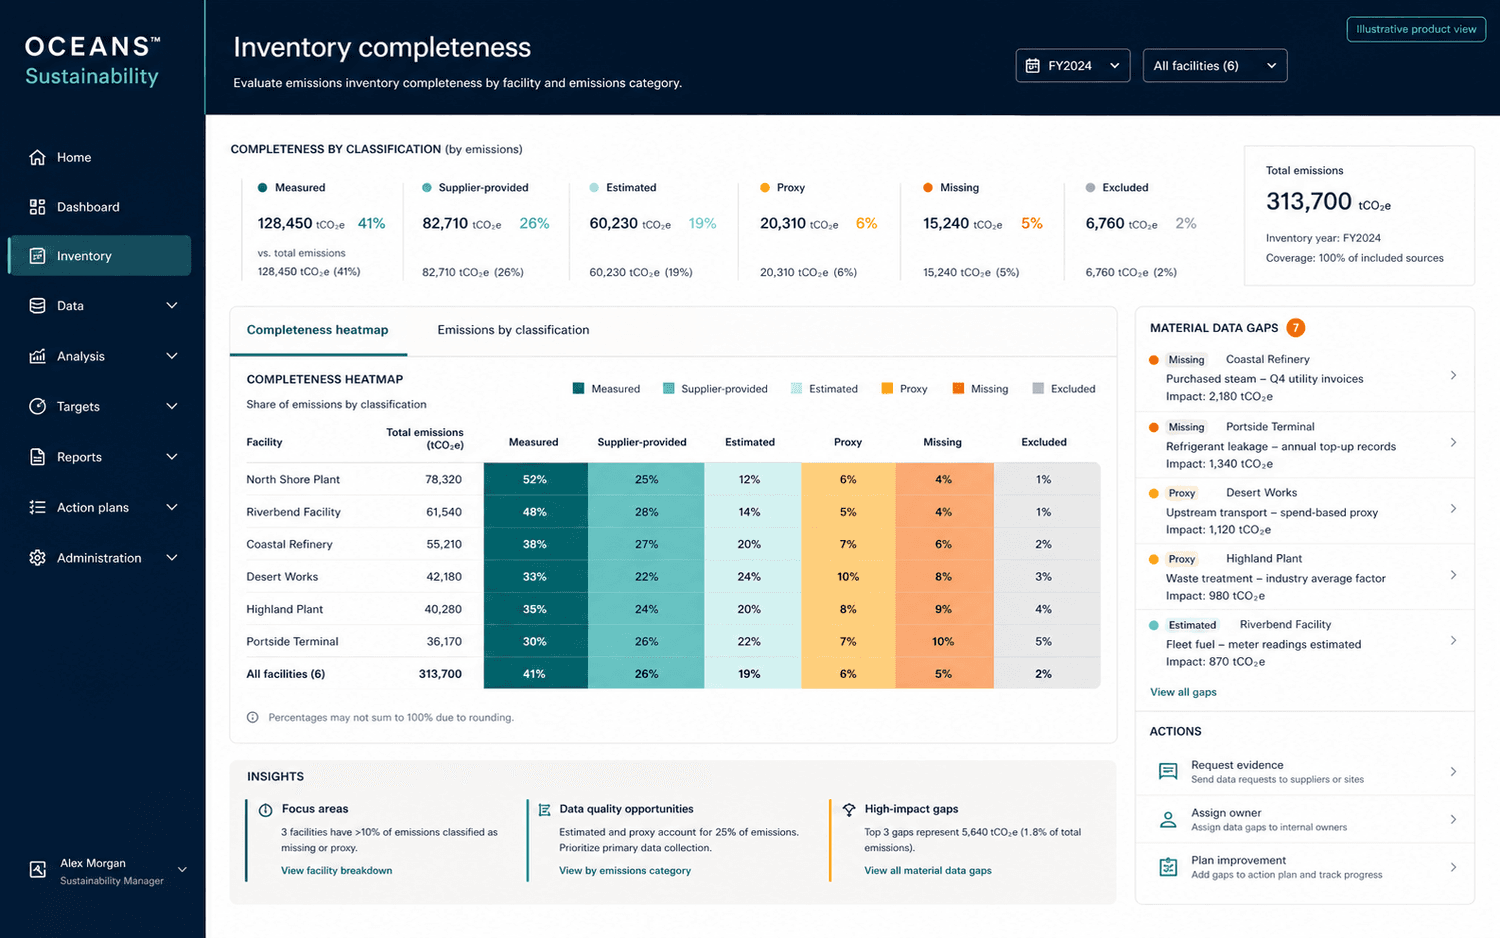
OCEANS™ Sustainability is designed to classify data according to its source and calculation status:
This classification provides context, not a verdict — it helps users see which parts of the inventory are supported by specific operational records and which depend on broader assumptions.
PROGRESSIVE IMPROVEMENT
Improve data where it can materially strengthen the result
- 01Directly measured facility or process data
- 02Supplier- or product-specific data
- 03Physical activity data
- 04Industry-average activity data
- 05Spend-based estimates
- 06Documented proxies or extrapolations
This is not an automatic quality score. Greater specificity is useful only when the boundary, methodology, period, and supporting information are suitable.
Identify potential issues before calculation and reporting
A robust review process considers checks such as:
Only checks confirmed as operational and tested are described as an OCEANS™ Sustainability capability.
A validation check identifies information requiring attention. It does not automatically prove that the submitted data are factually correct.
REVIEW BY EXCEPTION
Focus reviewers on information that needs attention
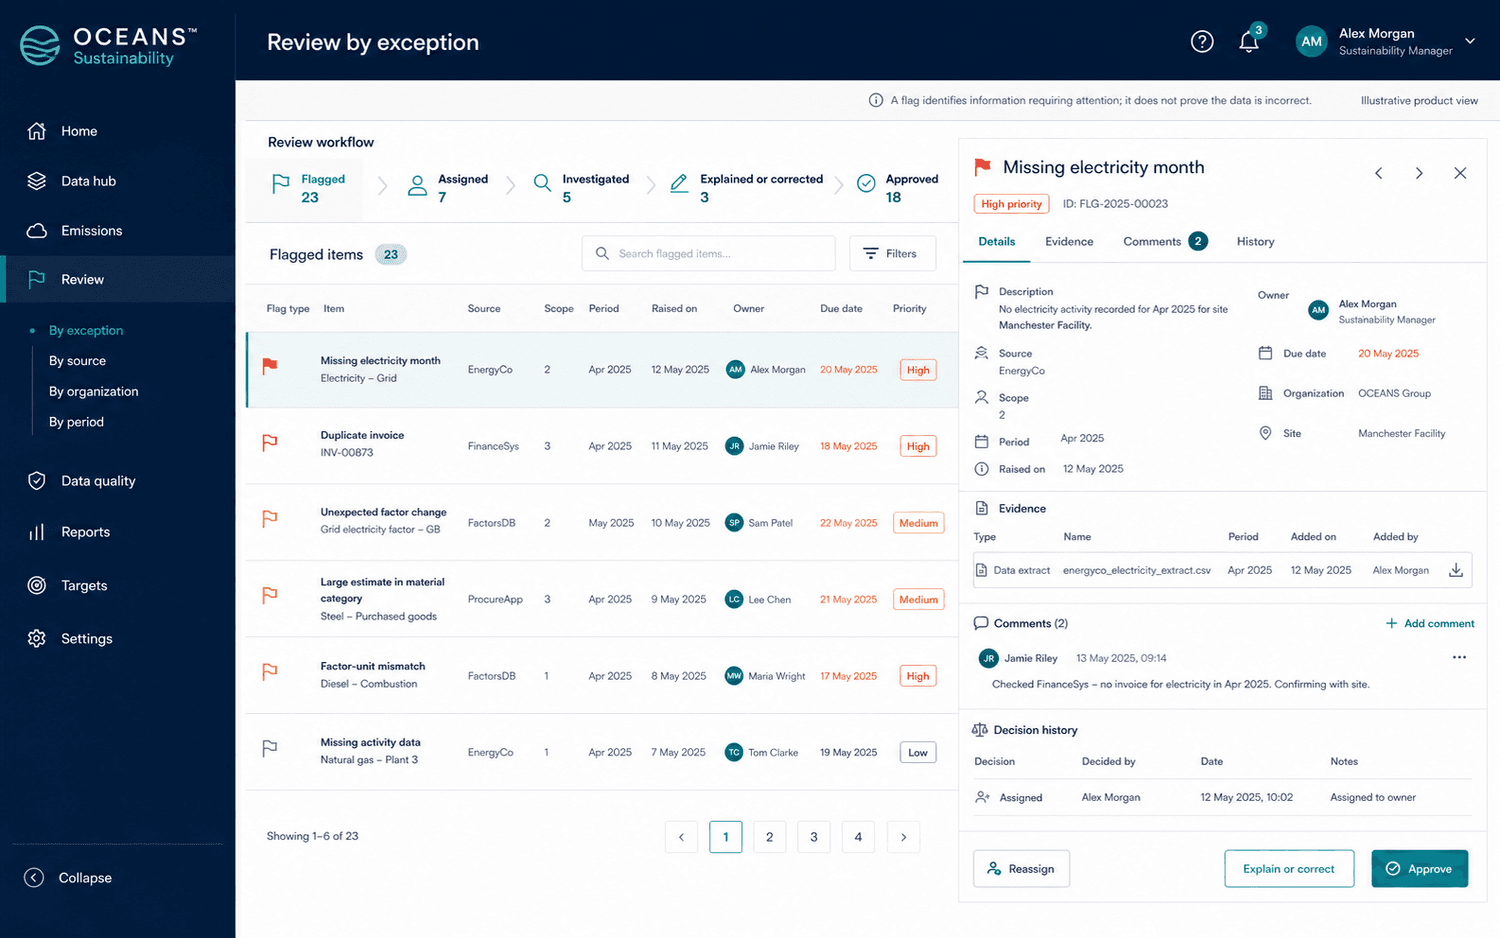
Rather than treating every record identically, a controlled review process can help identify values that fall outside expected patterns — for example:
- Flagged
- Assigned
- Investigated
- Explained or Corrected
- Approved
A flag identifies information requiring attention; it does not prove the data is incorrect. Automated anomaly detection, where used, is a review aid — not a determination that information is wrong.
Give every record a clear owner and status
Data quality is a controlled process involving contributors, reviewers, and approvers.
VERSION CONTROL
Understand what changed, when, and why
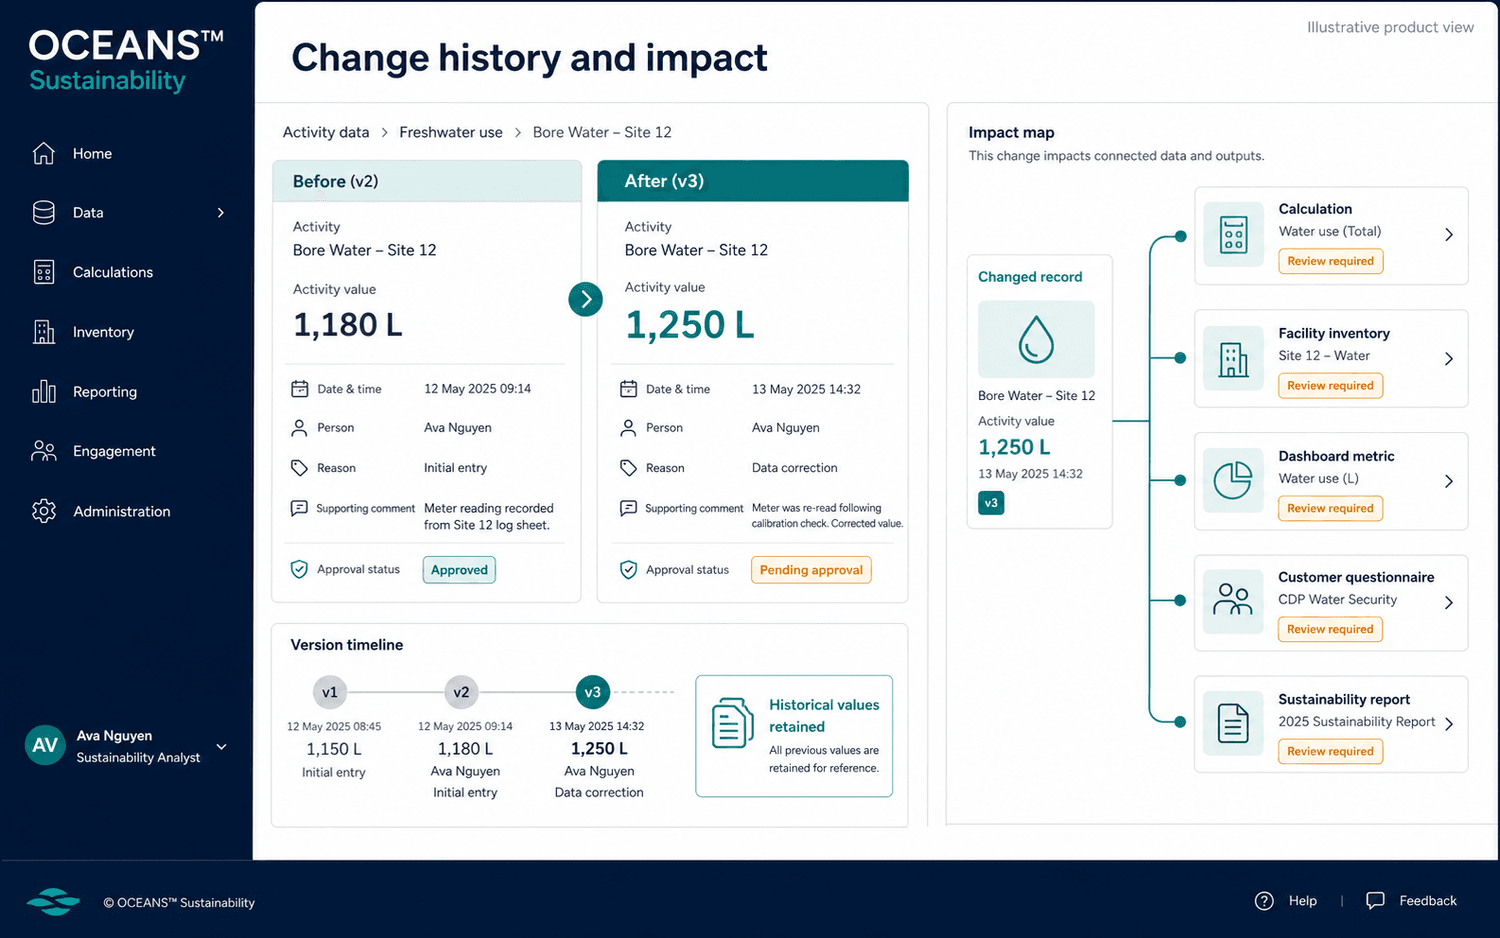
Activity data, emission factors, assumptions, and methodologies may change after their initial submission. OCEANS™ Sustainability is designed to retain a change history:
Historical information does not change silently when a factor library or methodology is updated. The illustration above shows a target review pattern for identifying affected calculations and reporting outputs — it is not a promise of automatic recalculation or automatic propagation into published disclosures.
Explain the result without reopening a complex workbook
For every emissions calculation, users should be able to answer:
- 01 Which business activity produced the result?
- 02 What was the original data source?
- 03 Which unit conversions were applied?
- 04 Which emission factor was used?
- 05 Why was that factor selected?
- 06 Which calculation method was applied?
- 07 Was any part estimated?
- 08 Who reviewed the result?
- 09 Has it changed since approval?
- 10 Where has it been reported?
Keep every factor connected to its source and version
VALUE-CHAIN DATA
Review supplier information before relying on it
Supplier-specific data may improve relevance, but its methodology and boundaries must be understood. OCEANS™ Sustainability helps document:
A supplier-provided figure is not automatically considered higher quality than a transparent secondary estimate.
Make uncertainty explicit
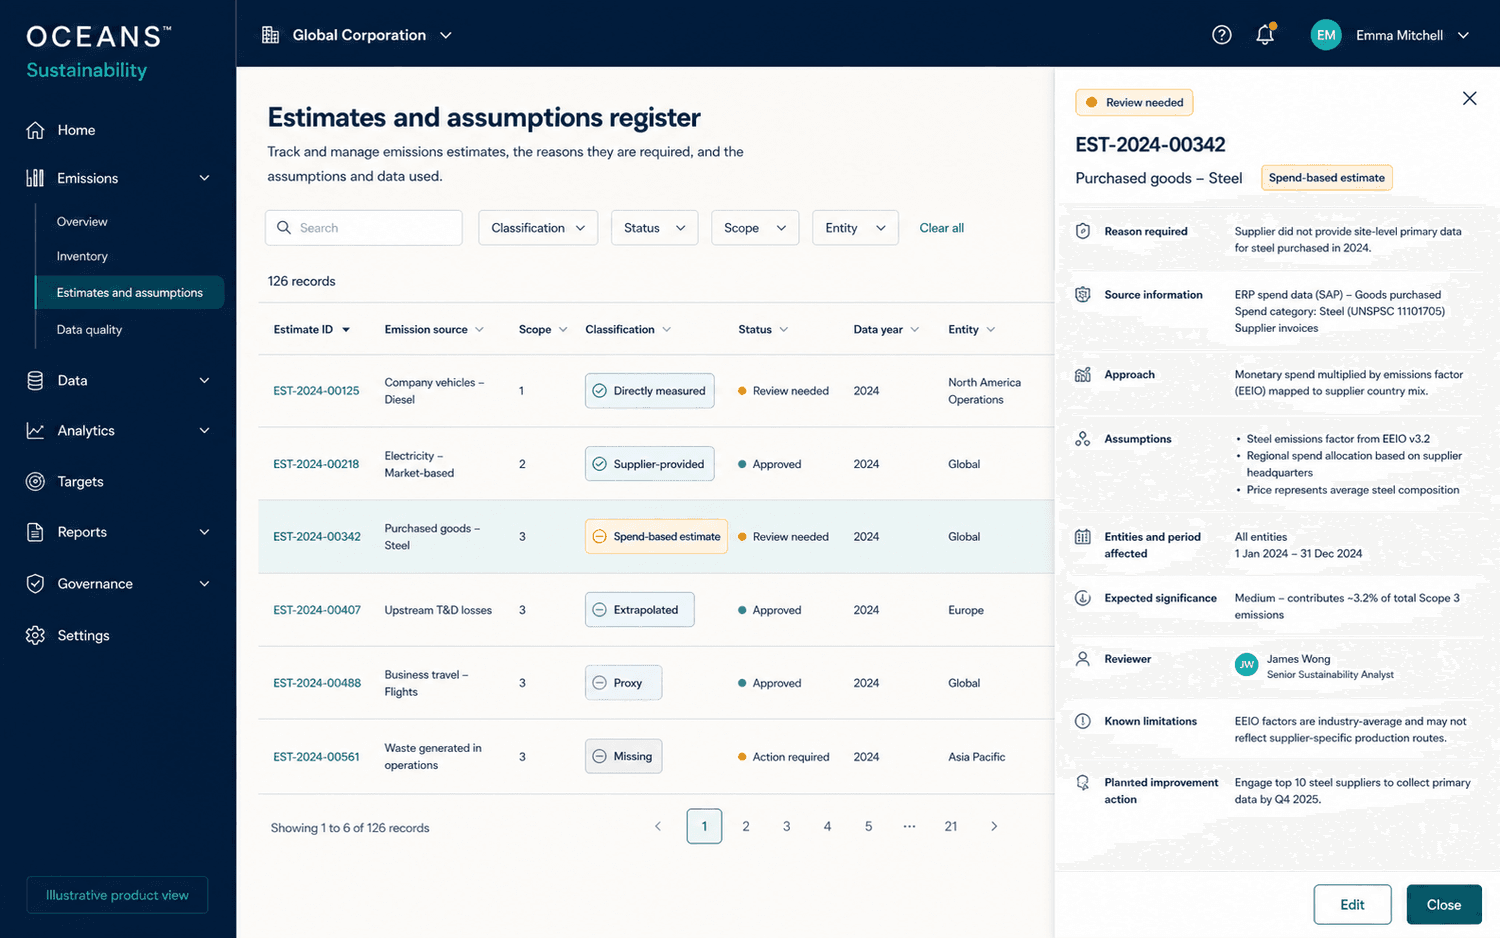
Incomplete data may require estimates, proxies, or extrapolation. OCEANS™ Sustainability is being designed to document these decisions rather than hiding them inside formulas. For every estimate, it is intended to retain reason, source, approach, assumptions, affected period and entities, expected significance, reviewer, known limitations, and planned improvement action.
Transparent estimates are more useful than unexplained precision. An approved estimate does not become measured data.
Keep published values connected to reviewed calculations
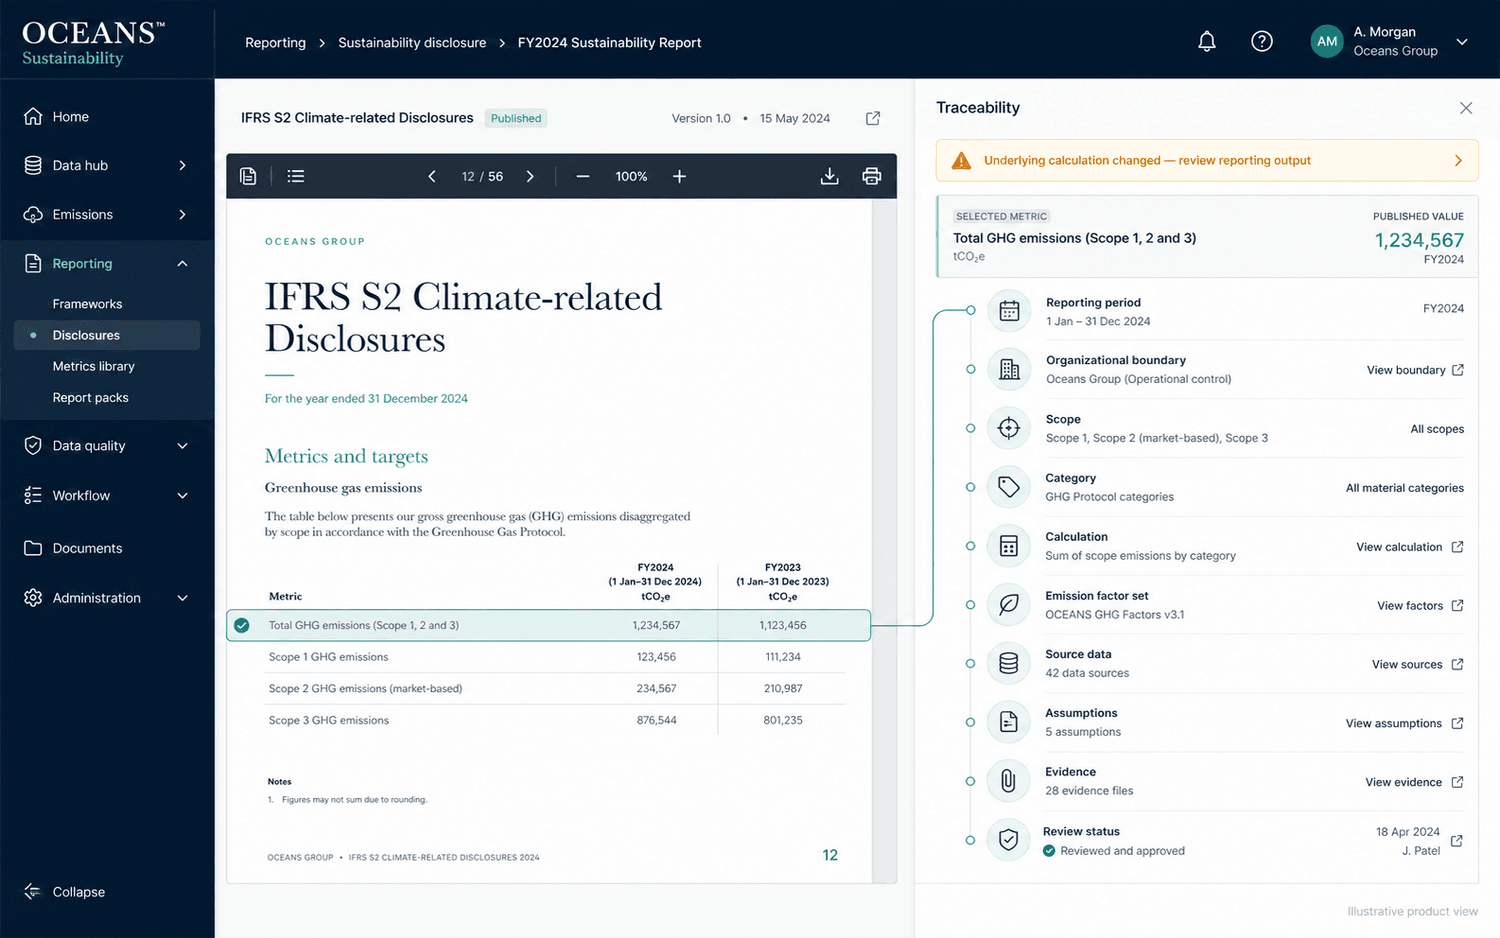
Reporting should not break the connection between a metric and its supporting information. OCEANS™ Sustainability helps maintain links between reported values and their relevant:
When an underlying calculation changes, affected reporting outputs should be identifiable for review — the illustration above shows this as a review condition to act on, not an automatic detection guarantee.
PREPARE FOR SCRUTINY
Organize information before an external review begins
OCEANS™ Sustainability can help teams prepare structured information for internal review or independent assurance, including:
The GHG Protocol emphasizes that quality-control issues and activity-data requirements should be addressed before emissions are estimated. GHG Protocol calculation guidance (opens in a new tab)
OCEANS™ Sustainability supports traceability and review preparation. It does not independently verify customer data or issue an assurance opinion.
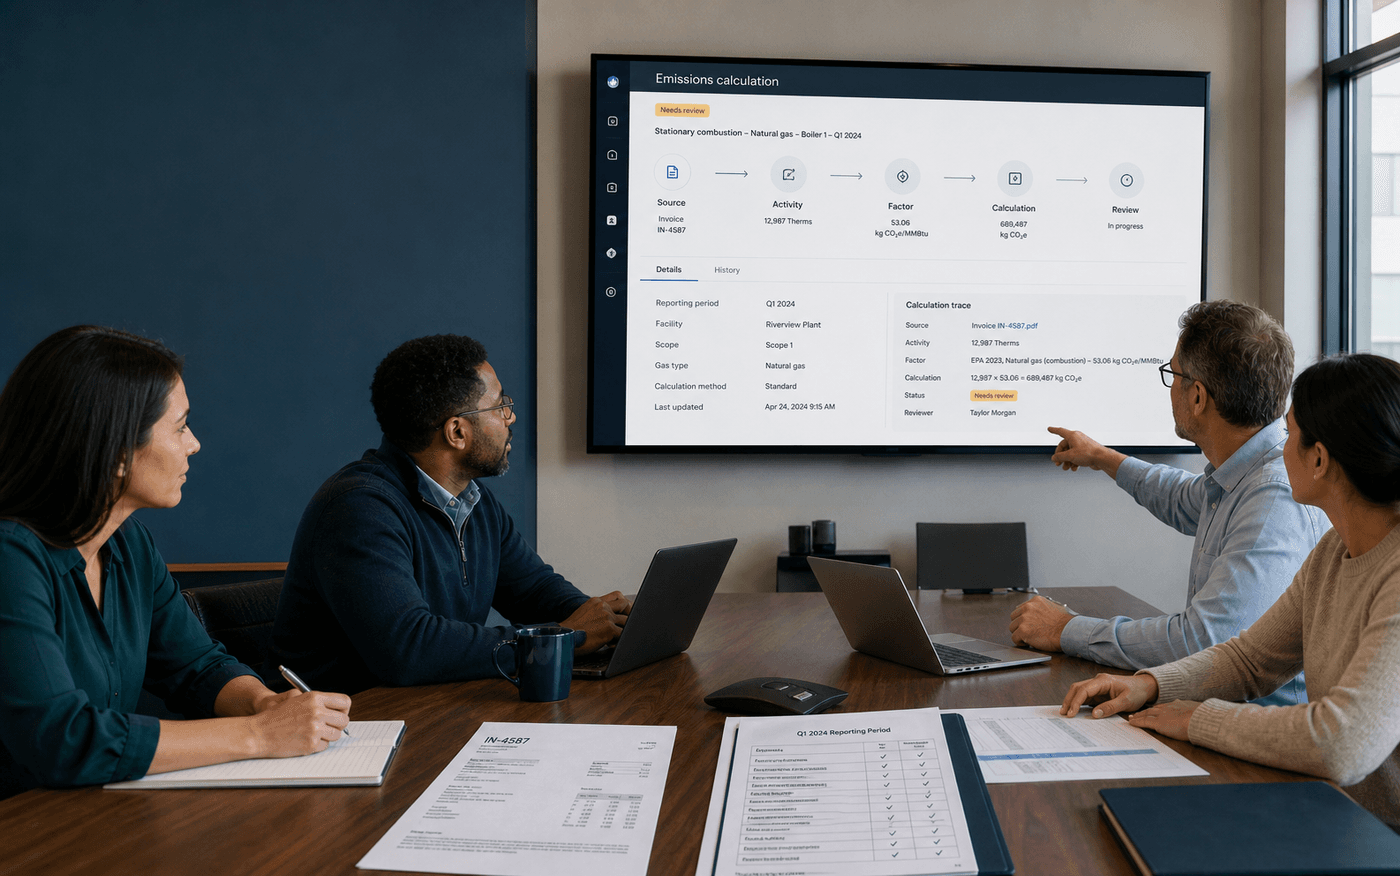
Data quality in practice
Resolving gaps and understanding methodology together
Sustainability, operations, finance and data owners, and technical reviewers typically resolve data gaps and align on methodology as a cross-functional group, not a single reviewer working alone.
Give people access appropriate to their responsibilities
A controlled data-quality process considers access appropriate to each person's responsibilities, such as:
Security certifications, encryption standards, retention controls, and data residency are described only on a dedicated security page once implemented and verified — none are claimed here.
Turn data gaps into an improvement plan
A useful data-quality process does not merely identify weaknesses — it helps teams decide what to improve next. OCEANS™ Sustainability can help prioritize:
Each reporting cycle should leave the organization with better information and a more repeatable process.
What OCEANS™ Sustainability helps teams do — and what it does not do
OCEANS™ Sustainability helps teams
- Structure sustainability data
- Preserve source records
- Document transformations
- Connect factors and calculations
- Identify potential quality issues
- Manage review workflows
- Retain change history
- Prepare information for scrutiny
OCEANS™ Sustainability does not
- Guarantee the accuracy of customer-submitted data
- Turn estimates into measured information
- Replace professional judgment
- Provide independent verification by itself
- Guarantee compliance with every reporting requirement
Need this traceability for a customer questionnaire under deadline? See EcoVadis and OEM supplier questionnaire response support .
Frequently asked questions
What data-quality dimensions does OCEANS™ Sustainability track?
Seven: completeness (is required information present), accuracy (does it reasonably represent the activity), consistency (comparable methods across entities and periods), timeliness (matches the reporting period), specificity (reflects the relevant supplier, facility, or activity), transparency (documented sources, methods, and assumptions), and traceability (can the result be followed back to its records).
What does the full lineage of an emissions result look like?
Seven stages: the source record, activity data, any transformation (cleaning, mapping, unit conversion), the emission factor, the calculation, the review, and finally the reporting output where the result appears — each stage retains its own identifying fields.
How are anomalies and exceptions handled?
Through a five-stage workflow: flagged, assigned, investigated, explained or corrected, and approved. Examples of what gets flagged include a sharp increase in facility electricity use, fuel consumption outside a historical range, a missing month of activity, or a duplicate invoice.
What does OCEANS™ Sustainability help with, and what does it not do?
It helps structure sustainability data, preserve source records, document transformations, connect factors and calculations, identify potential quality issues, manage review workflows, retain change history, and prepare information for scrutiny. It does not guarantee the accuracy of customer-submitted data, turn estimates into measured information, replace professional judgment, provide independent verification by itself, or guarantee compliance with every reporting requirement.
Build emissions information your team can trace and explain
See how OCEANS™ Sustainability is designed to connect source data, emission factors, calculations, assumptions, evidence, and review decisions in one structured workflow.