SCOPE 3 FOR MANUFACTURERS
Scope 3 carbon accounting for manufacturing supply chains
Collect, organize and assess supplier and procurement information across your manufacturing supply chain while keeping estimates, primary data, evidence, ownership and data-quality limitations visible.
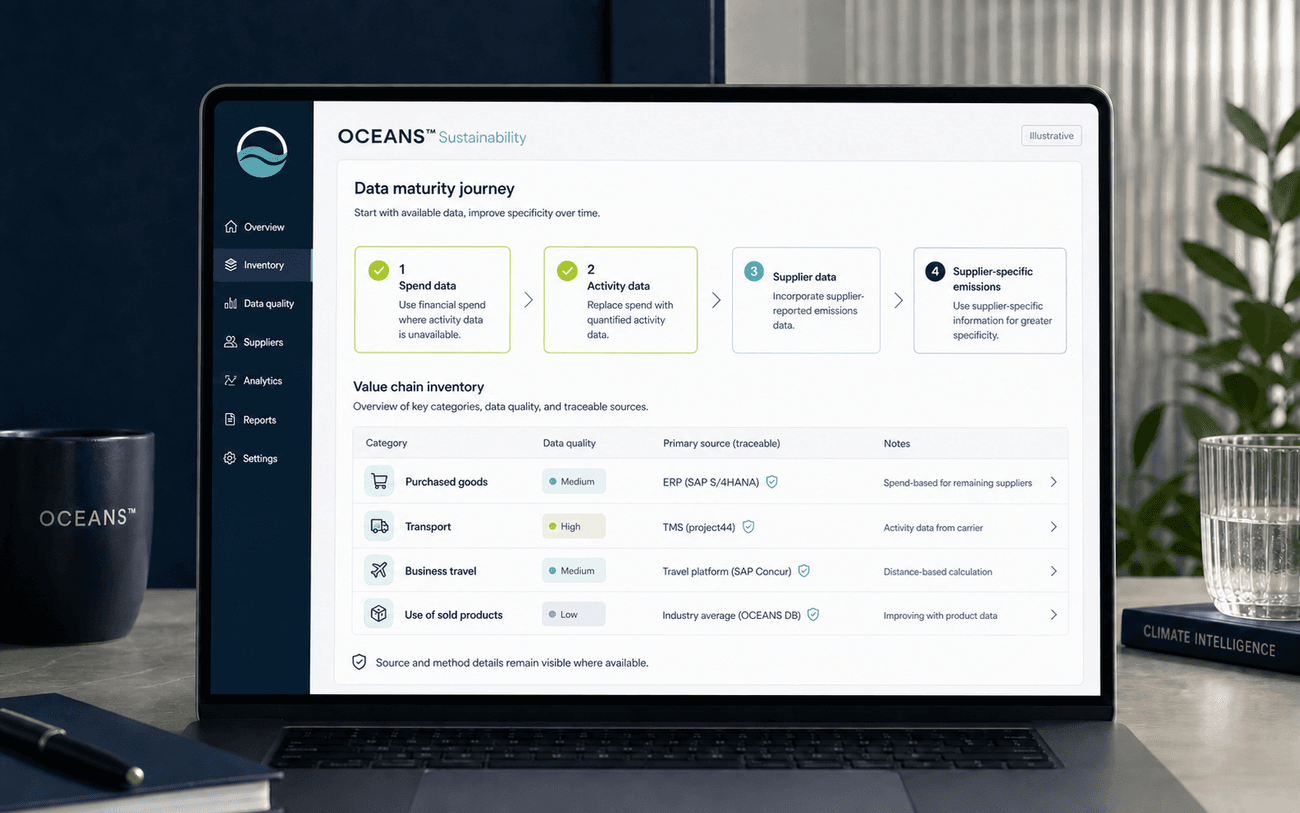
Start with available information. Focus on material categories. Replace estimates as better data becomes available.
See How OCEANS™ WorksMost of your emissions may sit outside your direct operations
For many companies, significant emissions occur across purchased goods, transportation, business travel, waste, suppliers, and the use of sold products.
But the required data is distributed across procurement systems, logistics providers, employees, suppliers, and spreadsheets. Different sources may use inconsistent formats, units, methodologies, and reporting periods.
OCEANS™ Sustainability is designed to give your team a structured way to build and improve a Scope 3 inventory without waiting for perfect value-chain data.
Common challenges
- Procurement data is not organized for emissions calculations
- Relevant Scope 3 categories are unclear
- Supplier-specific data is unavailable
- Teams depend heavily on spend-based estimates
- Suppliers submit information in different formats
- Calculation assumptions are poorly documented
- Data requests and follow-ups are managed through email
- Scope 3 results are difficult to explain
Who it is for
For companies ready to understand emissions beyond their own facilities
- Have an established or developing Scope 1 and 2 inventory
- Receive Scope 3 questions from customers or investors
- Need visibility into purchased goods and services
- Depend on complex suppliers or logistics networks
- Want to move beyond high-level spend estimates
- Need a repeatable supplier-data collection process
- Have limited internal sustainability resources
Relevant teams often include:
Begin with the categories that matter to your business
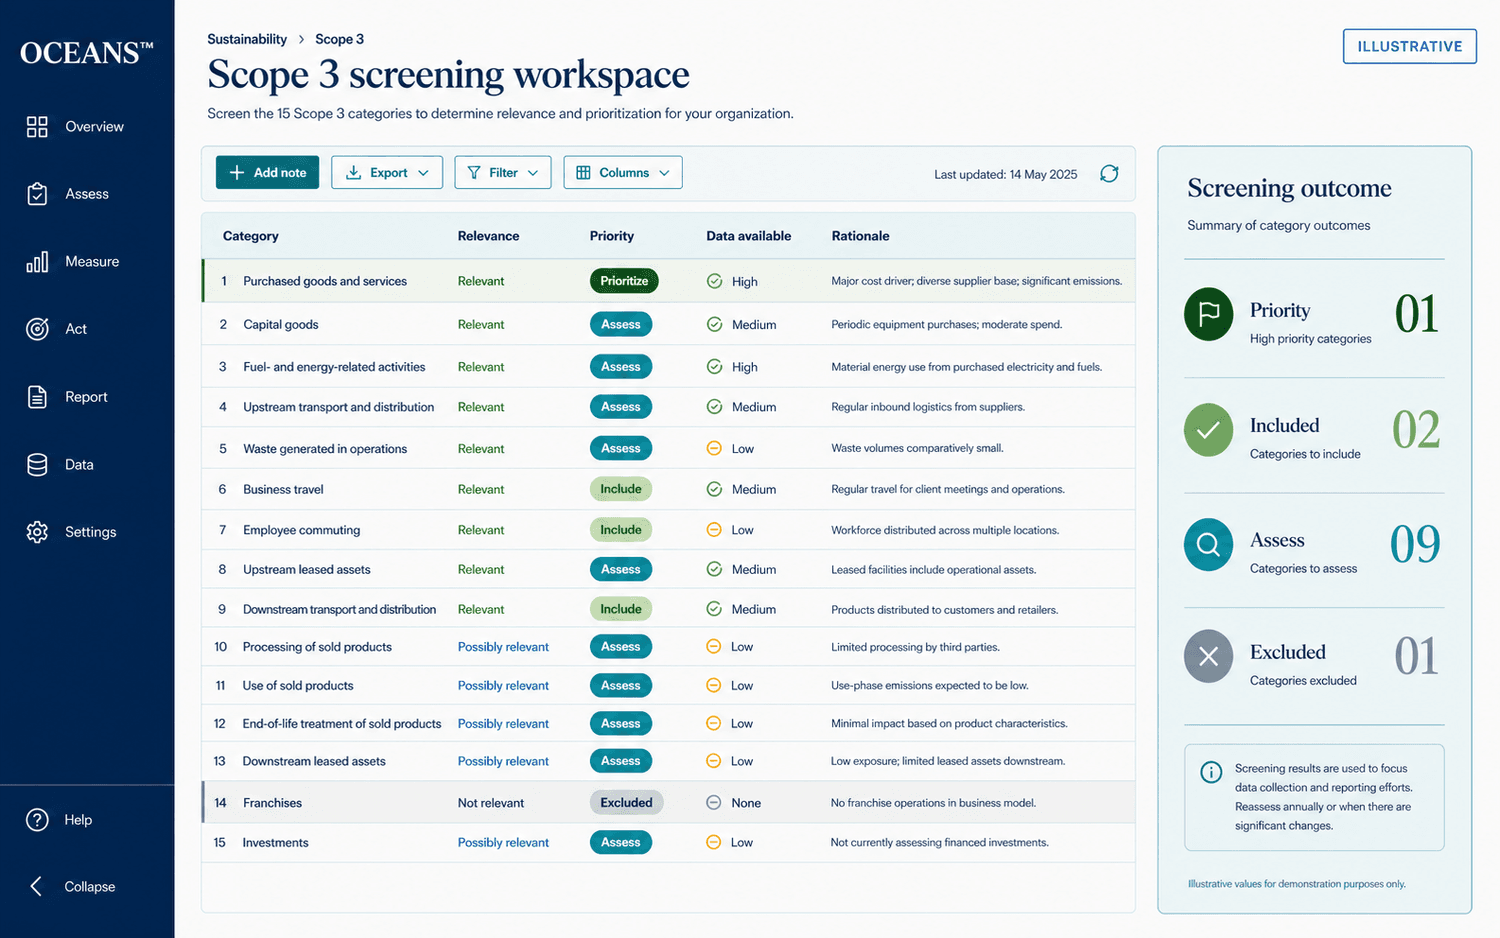
Not every Scope 3 category is equally relevant to every organization. OCEANS™ Sustainability is being designed to help teams assess potential categories based on business activities, value-chain structure, available information, reporting needs, and likely emissions significance.
Upstream categories (1–8)
- 01 Purchased goods and services
- 02 Capital goods
- 03 Fuel- and energy-related activities
- 04 Upstream transportation and distribution
- 05 Waste generated in operations
- 06 Business travel
- 07 Employee commuting
- 08 Upstream leased assets
Downstream categories (9–15)
- 09 Downstream transportation and distribution
- 10 Processing of sold products
- 11 Use of sold products
- 12 End-of-life treatment of sold products
- 13 Downstream leased assets
- 14 Franchises
- 15 Investments
Outcome: a documented view of which categories are relevant, which are prioritized, and which are currently excluded — with explanations.
How it works
A structured path from screening to better supplier data
Connected process
- Map the value chain
- Prioritize relevant categories
- Collect available information
- Select calculation methods
- Document estimates and gaps
- Engage priority suppliers
- Improve over time
Map the value chain
Identify key purchasing categories, suppliers, logistics activities, products, and downstream relationships.
Move progressively from estimates to more specific information
A Scope 3 inventory often begins with secondary data. OCEANS™ Sustainability is designed to help your team understand the calculation method and data quality behind each result.
Level 1
Spend-based estimates
Use financial purchasing data and relevant economic emission factors to create an initial view.
Level 2
Average activity data
Use physical quantities, product categories, distances, weights, or industry-average information.
Level 3
Supplier activity data
Collect more specific operational information directly from priority suppliers.
Level 4
Supplier-specific emissions
Use supplier-provided product or organizational emissions data where the methodology and boundaries are sufficiently clear.
Better data does not only mean more data. It means information that is relevant, traceable, and suitable for the calculation.
Purchased goods and services
Turn procurement records into Scope 3 insight
Procurement data can provide an initial view of emissions across purchased goods and services — but it must be categorized and interpreted correctly. Categorization is reviewed by your team; OCEANS™ Sustainability does not claim automated transaction categorization.
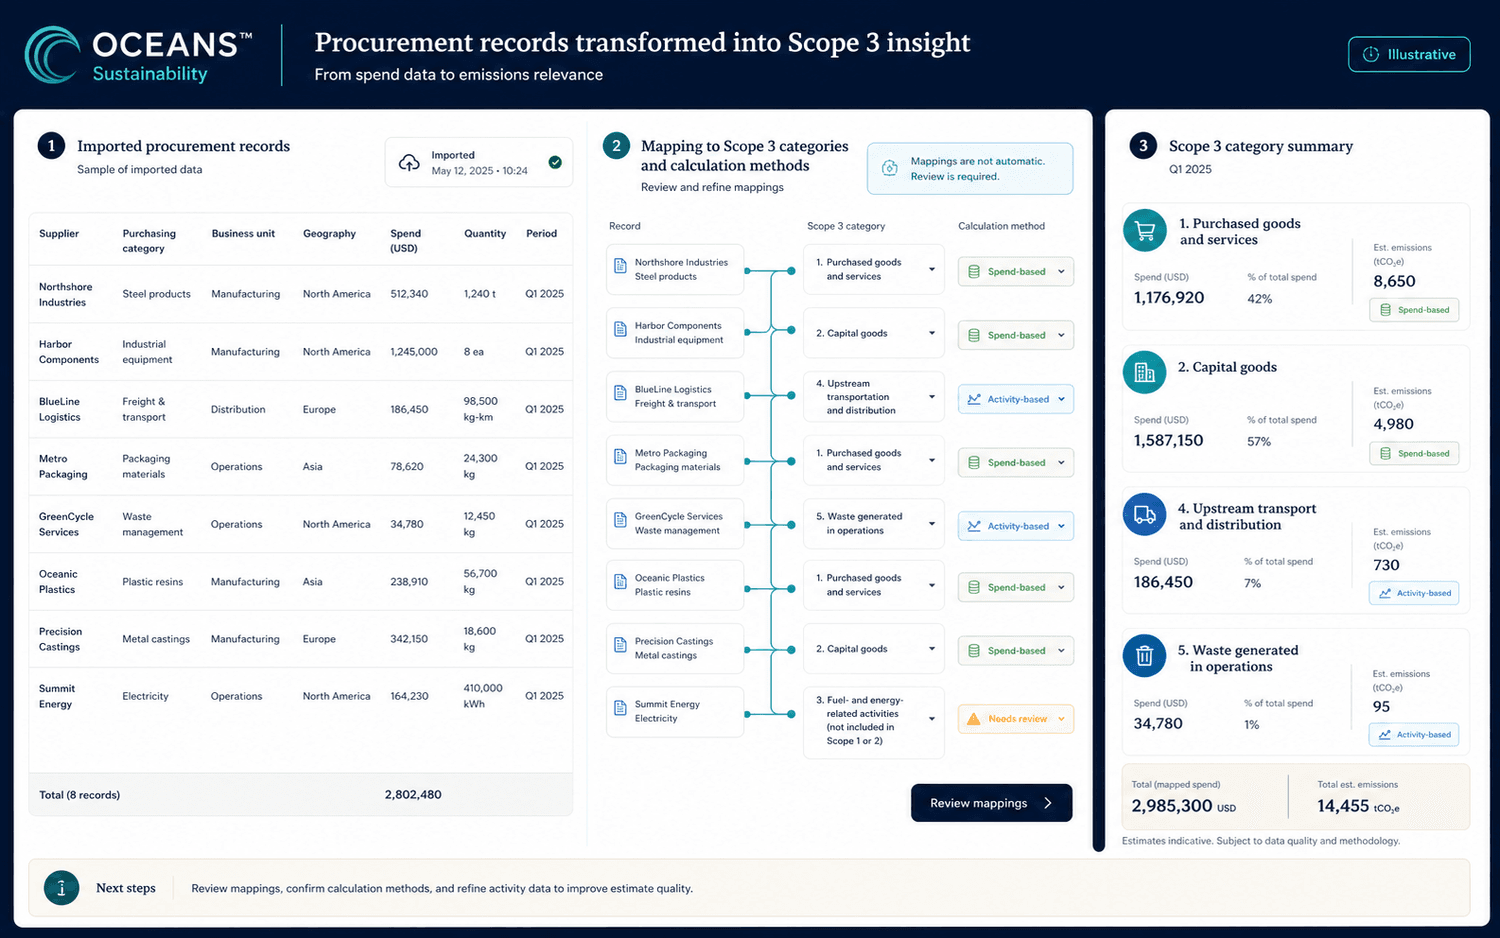
Organized by
Potential outcomes
- Identify emissions-intensive purchasing categories
- Find suppliers requiring better data
- Compare spend-based and activity-based results
- Prioritize procurement engagement
- Monitor changes between reporting periods
Category 1 methodology
Four standard ways to calculate purchased goods and services
For manufacturers, Category 1 typically covers raw materials, components, and packaging purchased from suppliers. The GHG Protocol Scope 3 Calculation Guidance describes four calculation methods for this category. This is educational guidance on standard methodology, not a claim that every method below is available today as a selectable calculation option.
- 01
Supplier-specific method
Uses emissions data reported directly by the supplier for the specific goods purchased — for example, a materials supplier providing product-level emissions per unit shipped. Most precise, but depends on supplier reporting maturity.
- 02
Hybrid method
Combines supplier-specific data where it exists with average-data or spend-based estimates for the remaining purchases in the same category, rather than requiring one method for every line item.
- 03
Average-data method
Applies an industry-average emission factor to the physical quantity purchased — for example, kilograms of a raw material or components produced — when supplier-specific data is not yet available.
- 04
Spend-based method
Applies an economic emission factor to the amount spent on a purchasing category. Useful for an initial estimate or for lower-priority categories where activity data has not been collected.
Source (conceptual reference, not a hyperlinked citation of specific figures used above): GHG Protocol Scope 3 Calculation Guidance (opens in a new tab)
Give suppliers a clear and consistent way to contribute
Supplier engagement is difficult when requests are unclear, overly complex, or managed through individual email threads. OCEANS™ Sustainability is designed to help structure the collection process so suppliers understand what information is requested and your team can monitor what has been received.
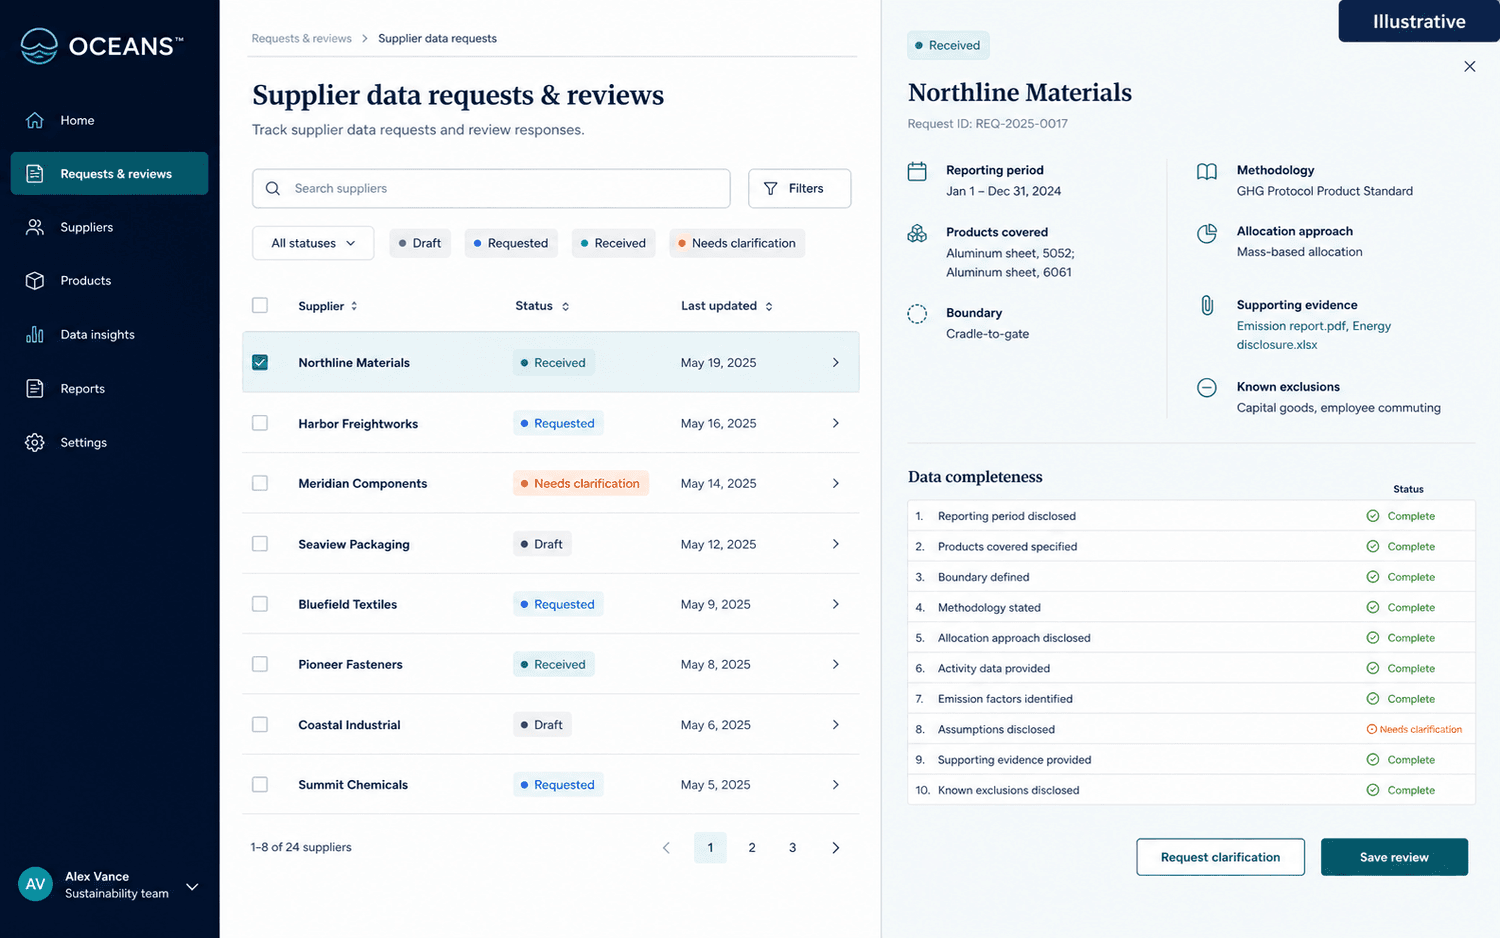
A supplier portal, automated reminders, or bulk outreach are only included above where currently supported.
How supplier data actually gets in
Spreadsheet/CSV import, guided field mapping, supplier web forms, and direct API or ERP connectors are different levels of integration sophistication — not interchangeable claims. A utility connection or a one-time spreadsheet import alone does not resolve Scope 3 measurement: utility-bill activity data covers Scope 1 and 2, while Scope 3 requires the procurement and supplier data layer described on this page.
Spreadsheet and CSV import
Near-term planned approach
Bring in procurement and supplier records in the formats your team already works in.
Guided field mapping
Near-term planned approach
Map inconsistent supplier file columns to a consistent structure before calculation.
Supplier web-form submission
Near-term planned approach
Give suppliers a structured request in place of an open-ended email thread.
Direct API and ERP connectors
Further planned capability, not available today
Pull procurement or supplier records automatically from source systems.
Data quality
A supplier number is not automatically a better number
Supplier-provided emissions data must be understood before it is used. Differences in boundaries, reporting periods, allocation methods, emission factors, and assurance status can materially affect comparability. A supplier's own corporate total is not directly usable by a buyer without applying an appropriate allocation method and matching boundaries — the total must be allocated to your share of purchases before it can be added to your Scope 3 inventory.
Documented for every submission
The objective is to make supplier data explainable — not merely collect more responses.
Understand the method behind each Scope 3 result
OCEANS™ Sustainability is designed to connect calculated emissions to the underlying procurement record, activity data, supplier submission, emission factor, assumption, and calculation method.
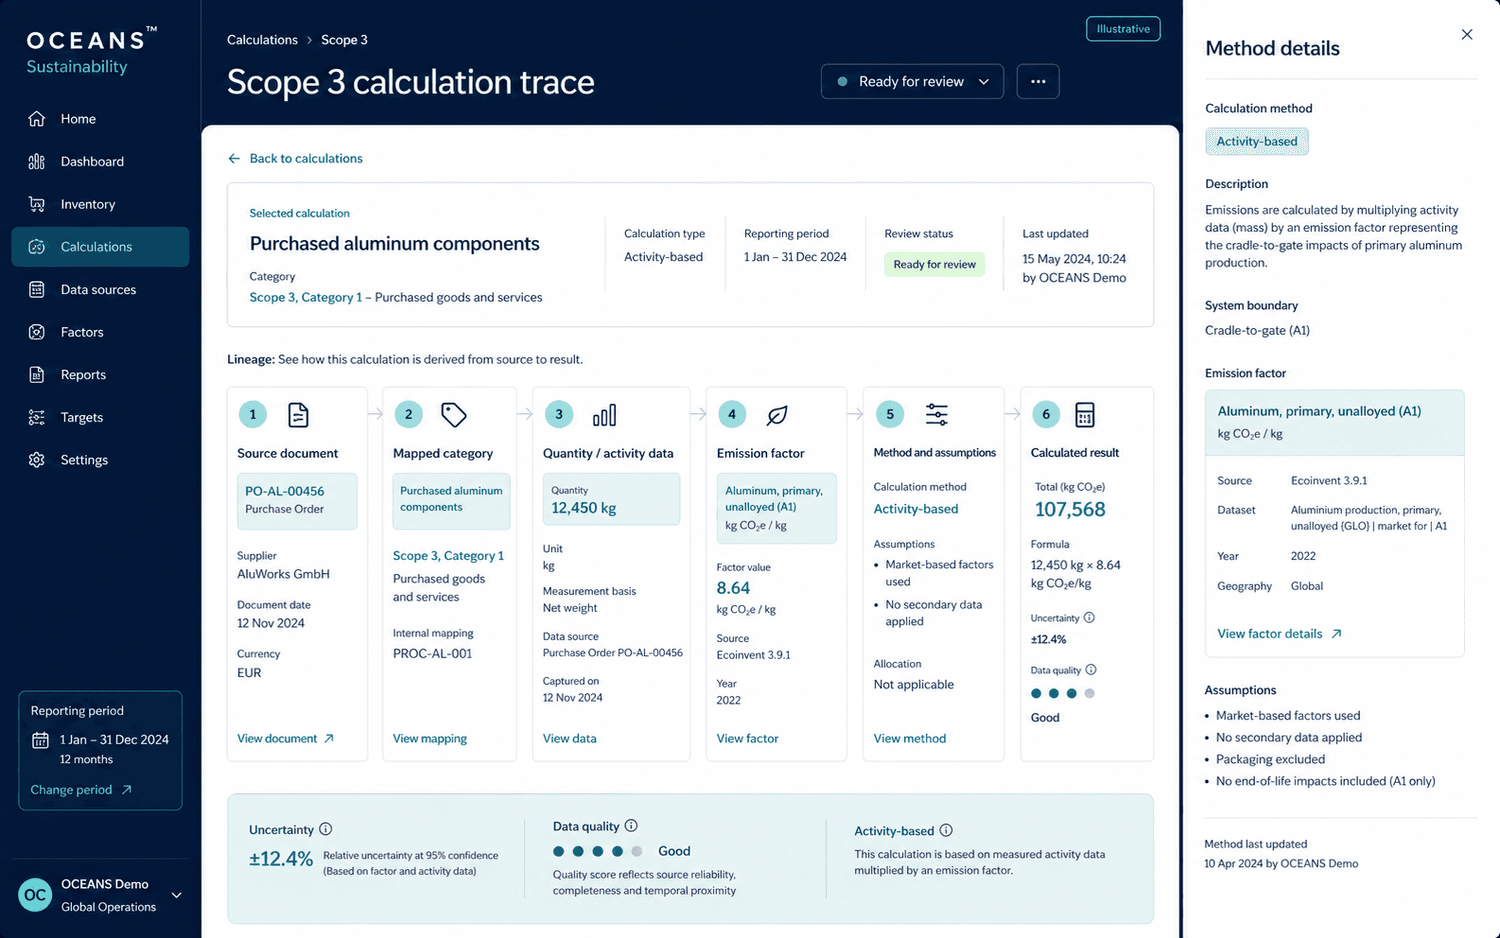
Illustrative example — hypothetical purchase record
From a purchase record to a traceable Category 1 result
- Supplier (hypothetical)
- Meridian Aluminum Extrusions Co.
- Material purchased
- Aluminum extrusions for enclosure fabrication
- Quantity
- 18,400 kg
- Spend
- $94,300
- Reporting period
- Q2
- Calculation method
- Average-data method (Category 1: Purchased goods and services)
- Emission factor (illustrative)
- 8.5 kg CO2e per kg of aluminum extrusions
- Calculation
- 18,400 kg × 8.5 kg CO2e/kg = 156,400 kg CO2e
- Result
- 156.4 t CO2e for this purchase record
This is a hypothetical purchase record built to illustrate the calculation chain for a manufacturer — not a real customer, supplier, or transaction. The emission factor shown is an illustrative example only, not a value sourced from a real licensed factor database.
Your team can distinguish between
Values, supplier names, and factor-database labels shown in the illustration above are fictional examples, not a claim about supported factor libraries.
Explore Calculate EmissionsKeep uncertainty visible
Scope 3 calculations often rely on assumptions. OCEANS™ Sustainability is designed to help document why an approach was selected, what information was unavailable, and how the result can be improved.
Maintain records of
Transparent estimates create a stronger foundation than unexplained precision.
Focus effort where better data can make the greatest difference
A Scope 3 inventory should help your company decide where to improve data, engage suppliers, and investigate reduction opportunities.
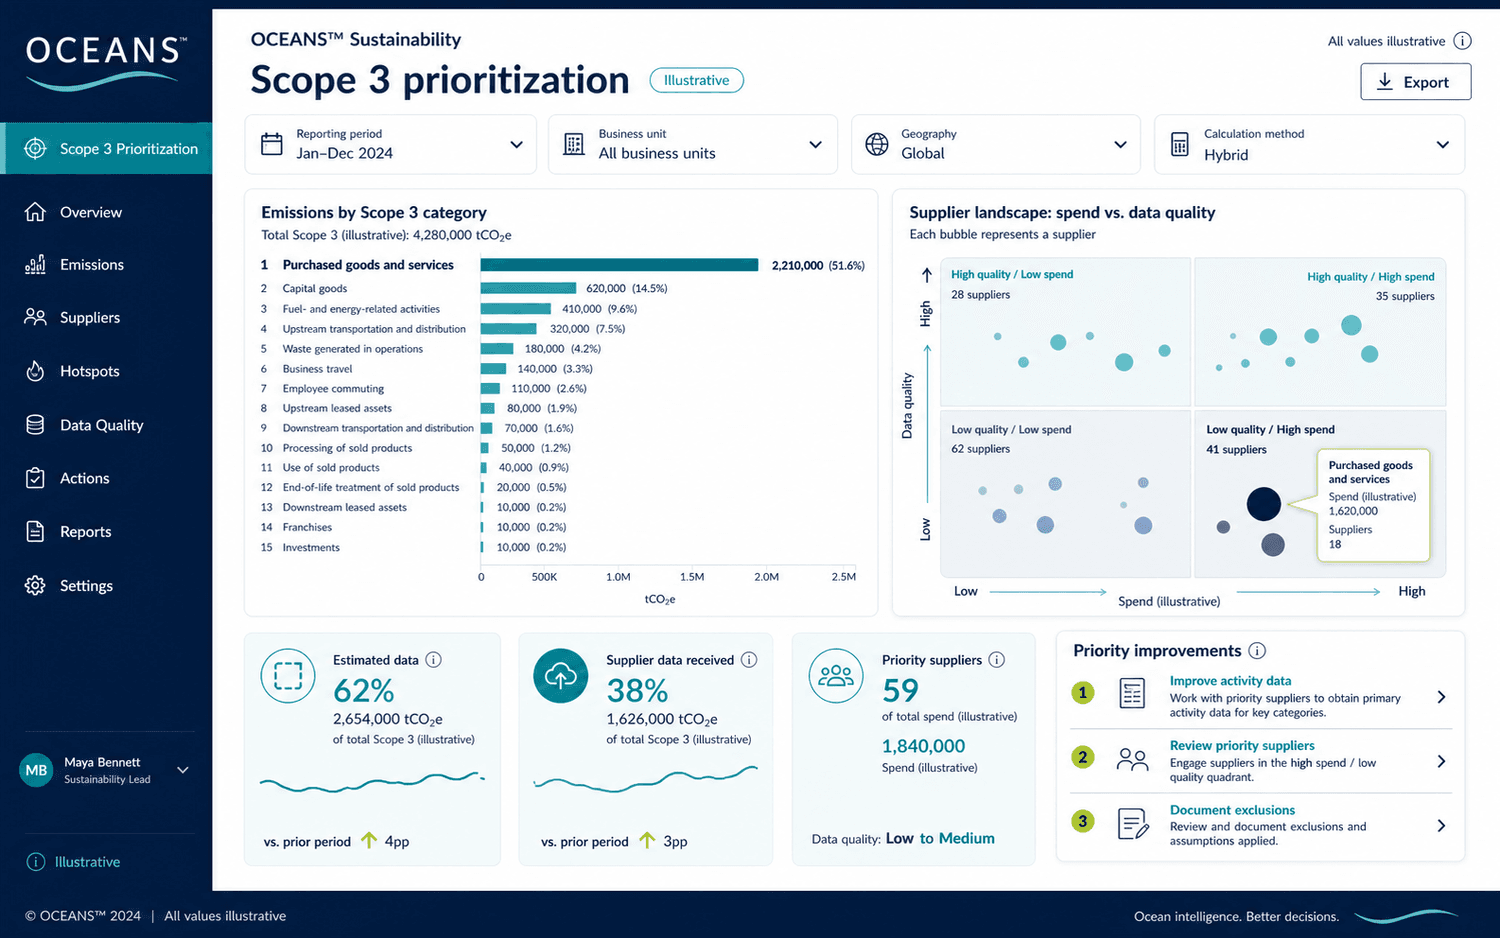
Explore emissions by
Potential outcomes
- Identify emissions hotspots
- Prioritize strategic suppliers
- Locate categories dependent on estimates
- Target better activity data
- Track supplier participation
- Monitor year-over-year changes
Do not ask every supplier for everything at once
Effective supplier engagement begins with prioritization. OCEANS™ Sustainability is designed to help support a phased approach:
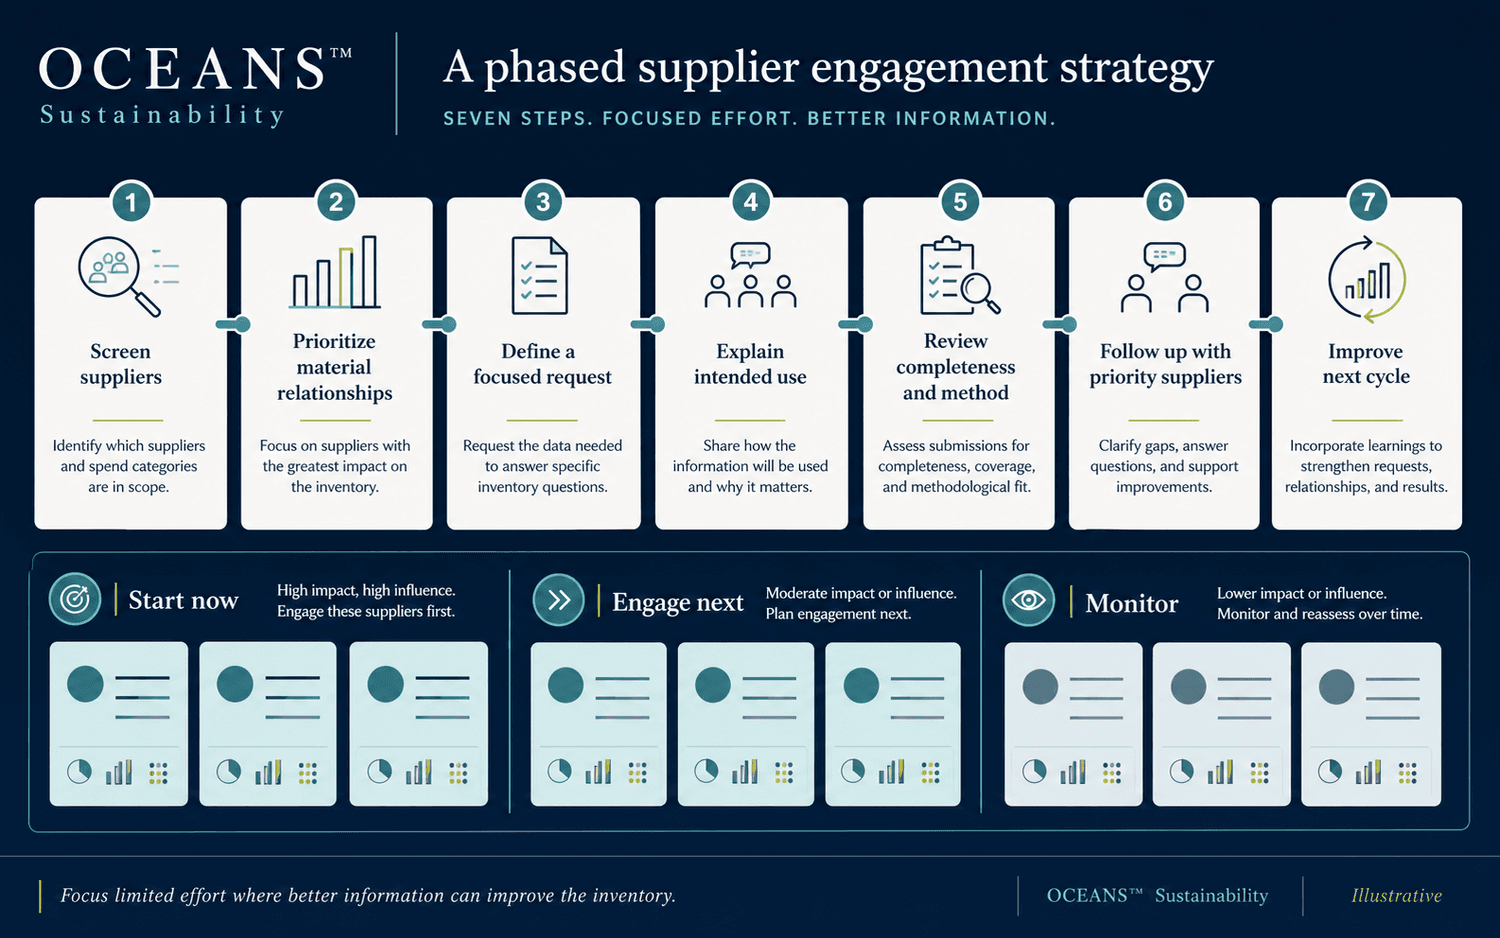
- 1
Screen suppliers using available procurement information
- 2
Identify emissions-relevant and strategically important suppliers
- 3
Define a focused information request
- 4
Explain how the requested data will be used
- 5
Review responses for completeness and methodological fit
- 6
Follow up with priority suppliers
- 7
Improve coverage during subsequent reporting cycles
This concentrates limited resources on the suppliers and categories most likely to improve the inventory.
Use Scope 3 information beyond disclosure
Respond to customers
Prepare more consistent answers to value-chain and procurement requests.
Improve purchasing visibility
Understand which categories and suppliers influence reported emissions.
Strengthen supplier conversations
Engage suppliers using documented information rather than broad assumptions.
Prioritize data improvement
Identify where estimates materially affect the inventory.
Support reduction planning
Focus investigation on significant value-chain emissions sources.
Build a repeatable process
Retain supplier information and calculation history across reporting periods.

Direct guidance
Work with the OCEANS™ team, not just the software
Scope 3 decisions — which categories matter, which suppliers to prioritize, which method fits which gap — benefit from direct guidance alongside the platform, not a self-serve tool alone.
Why OCEANS™
Practical Scope 3 management for lean teams
Start with available data
Build an initial inventory without waiting for every supplier.
Improve progressively
Replace estimates as better activity and supplier information becomes available.
Maintain transparency
Connect results to methods, factors, assumptions, and supporting evidence.
Prioritize engagement
Focus attention on material categories and important suppliers.
Get direct guidance
Work with the OCEANS™ team to structure data collection and calculation decisions.
OCEANS™ Sustainability is intended to turn Scope 3 from an overwhelming data problem into a manageable improvement process.
Frequently asked questions
Where to go next
Current availability
OCEANS™ Sustainability is in active product development. Access is currently limited to founding design partners — the workflow, screens, and outcomes described on this page are the design in progress, and any product screens shown are an illustrative preview of planned functionality. Guides, checklists, and the calculator elsewhere on this site are real and available now. Apply as a founding design partner to help test and shape this workflow as it is built.
Build a Scope 3 process that improves with every reporting cycle
Tell us what value-chain information you currently have. OCEANS™ will help you identify relevant categories, understand data gaps, and create a practical improvement path. Begin with a focused review of your procurement records, suppliers, emissions categories, and reporting objectives.