OCEANS™ PREPARE REPORTS
Turn reviewed carbon data into stakeholder-ready sustainability reports
Organize reviewed Scope 1, 2 and 3 emissions data, methods, evidence and reporting boundaries into consistent outputs for customers, management and sustainability disclosures.
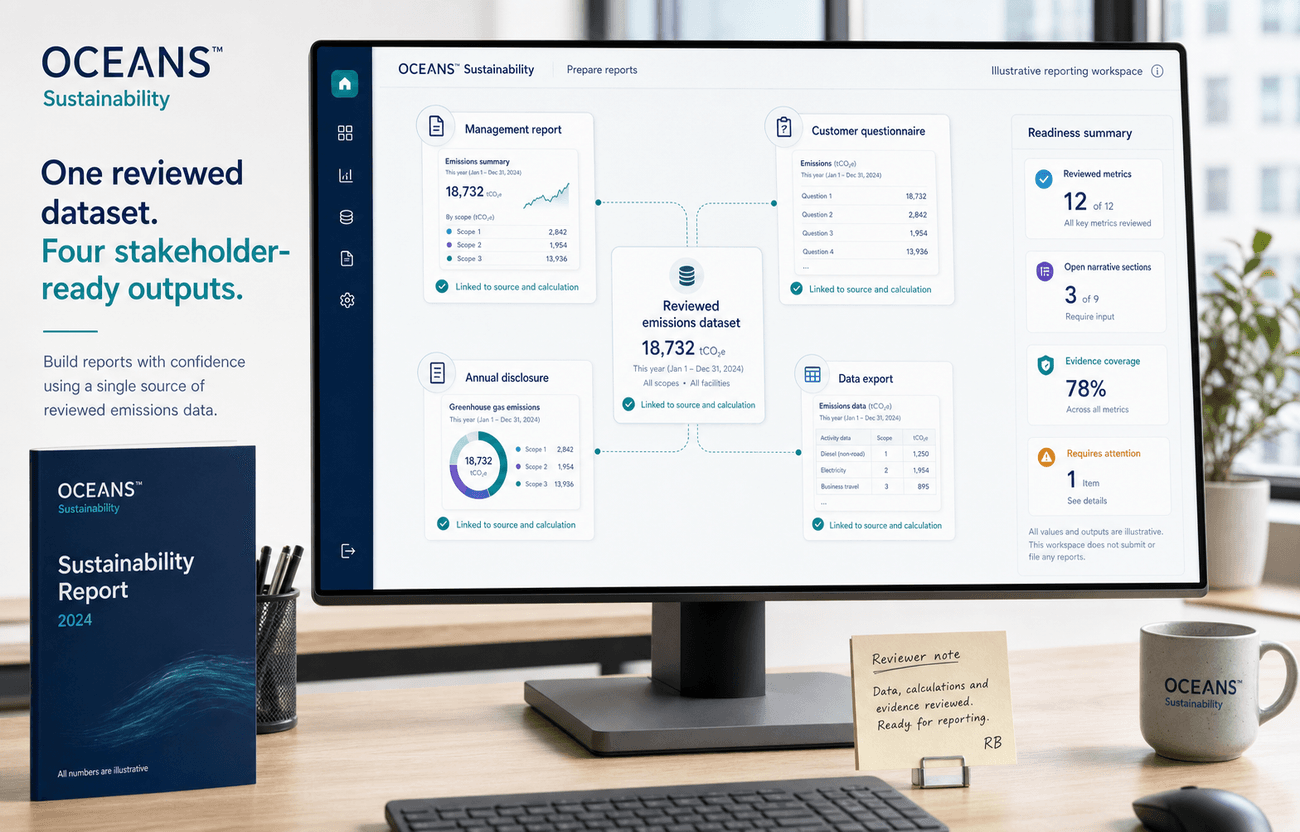
Report without rebuilding your emissions information every time.
Explore the platformOne reviewed dataset can support outputs such as:
- Management report
- Customer questionnaire
- Annual disclosure
- Data export
These output labels are illustrative — not proof that every format is shipped today.
Stop rebuilding the same information for every request
Sustainability information is repeatedly requested by customers, investors, management, procurement, and reporting programs. Disconnected files create duplicated work, inconsistent answers, lost evidence links, and version confusion.
Repetitive reporting
The same emissions information gets rebuilt for every new request.
Inconsistent answers
Different files and spreadsheets can drift out of sync with each other.
Disconnected evidence
Supporting documents get separated from the numbers they support.
Changing requirements
Each audience asks for a similar story in a different structure.
OCEANS™ Sustainability helps your team prepare reporting outputs from one structured and reviewed sustainability-data foundation.
Stakeholder-ready reporting
Show the complete reporting story—not only a carbon total
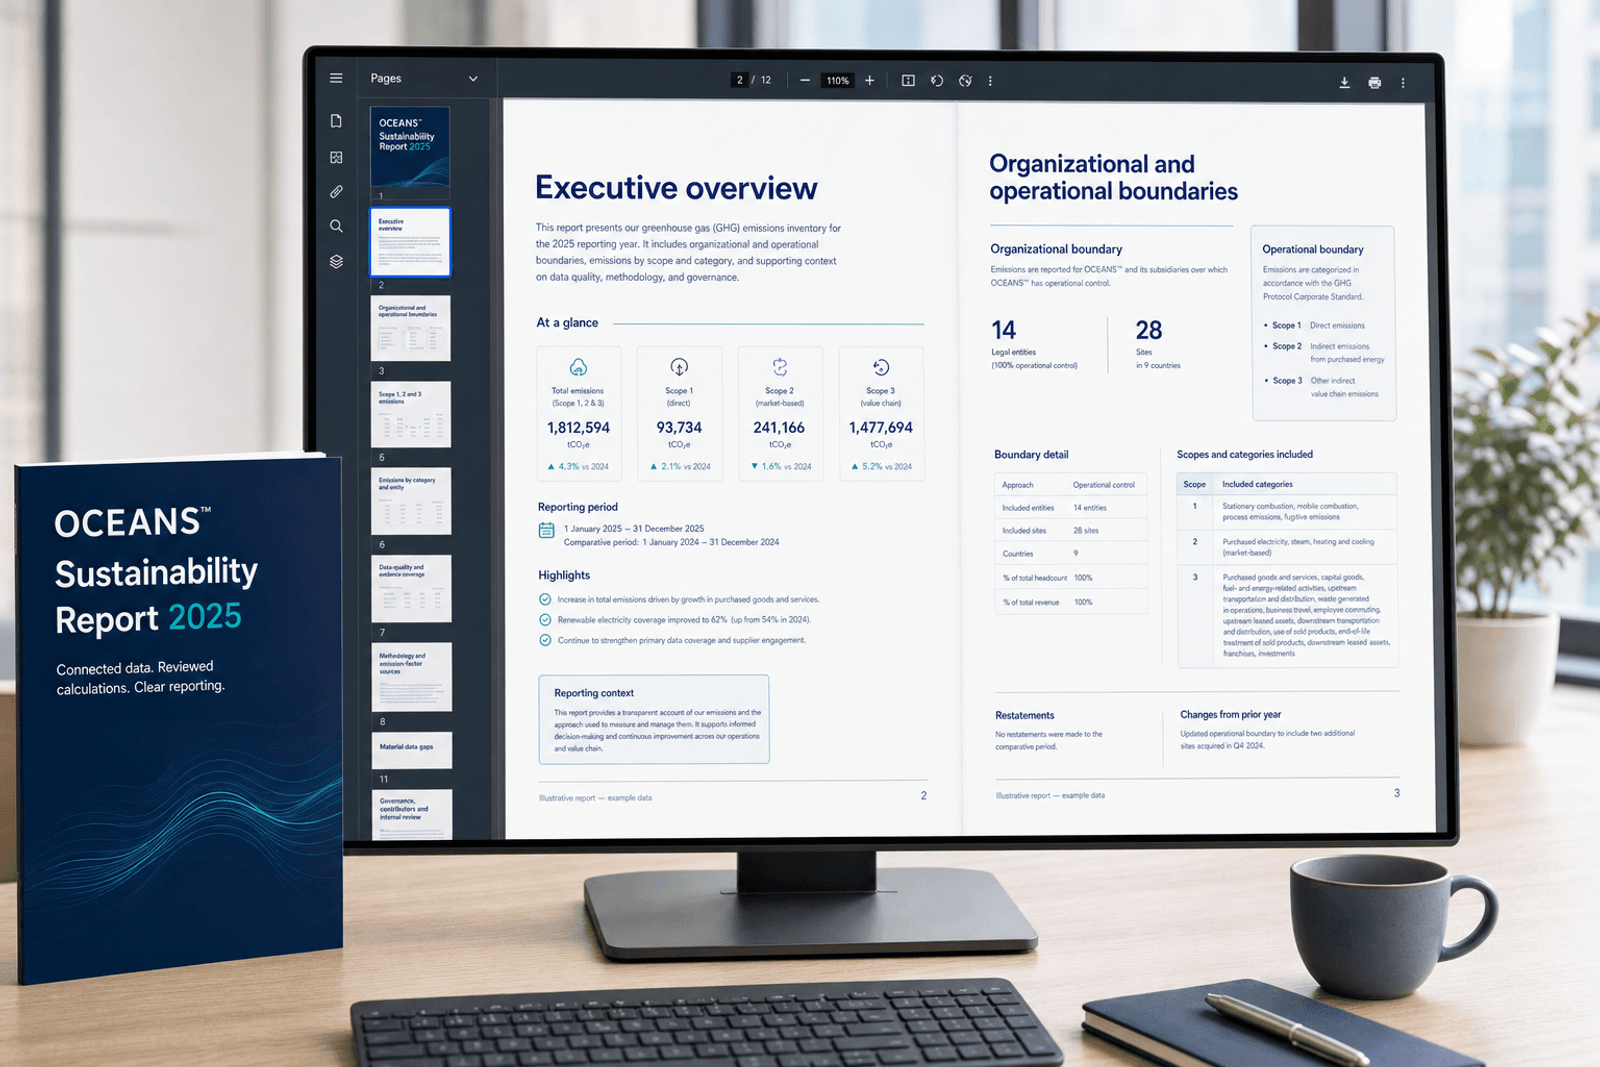
A credible sustainability report combines a lot more than a single number. It can bring together:
- Executive overview
- Organizational and operational boundaries
- Scope 1, 2, and 3 inventory
- Category, entity, and period comparisons
- Data-quality and evidence coverage
- Methodology and factor sources
- Estimates, assumptions, exclusions, and limitations
- Material data gaps
- Calculation and evidence references
- Governance, contributor, and internal review context
Connected reporting
Begin with reviewed data—not a blank document
Reporting information can retain its relationship to the entity, period, scope, category, activity data, factor, method, assumptions, evidence, and internal review status behind it.
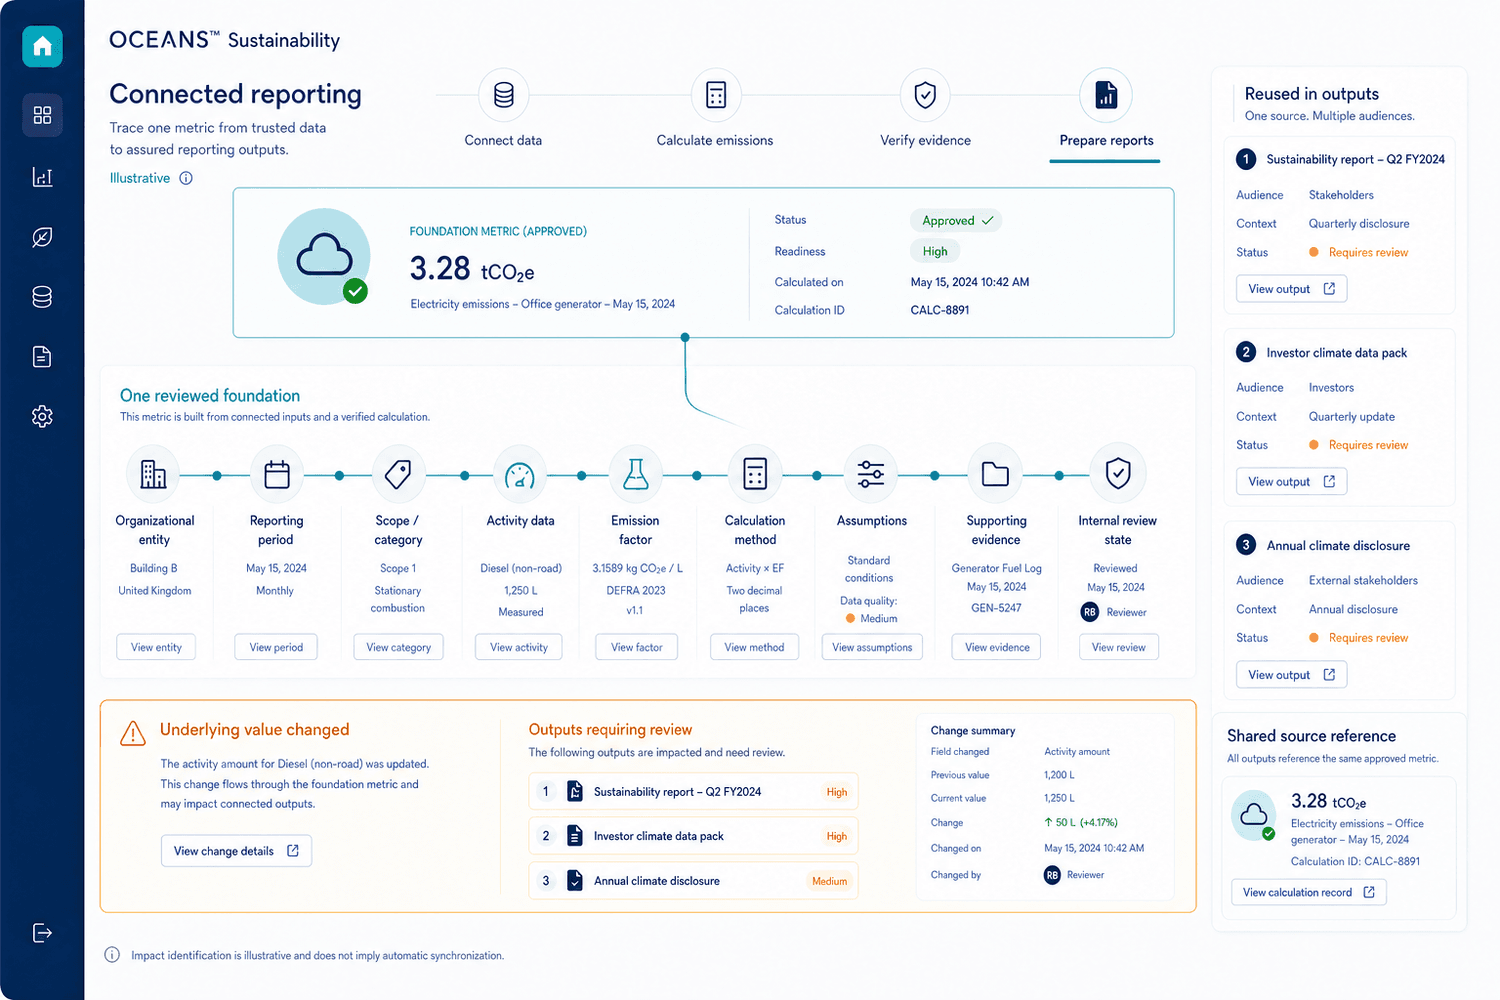
When an underlying value changes, potentially affected outputs are identified for review — a person decides whether to update them, not an automatic, silent synchronization. Human review remains required before changing published content.
How it works
A clear process from approved data to final output
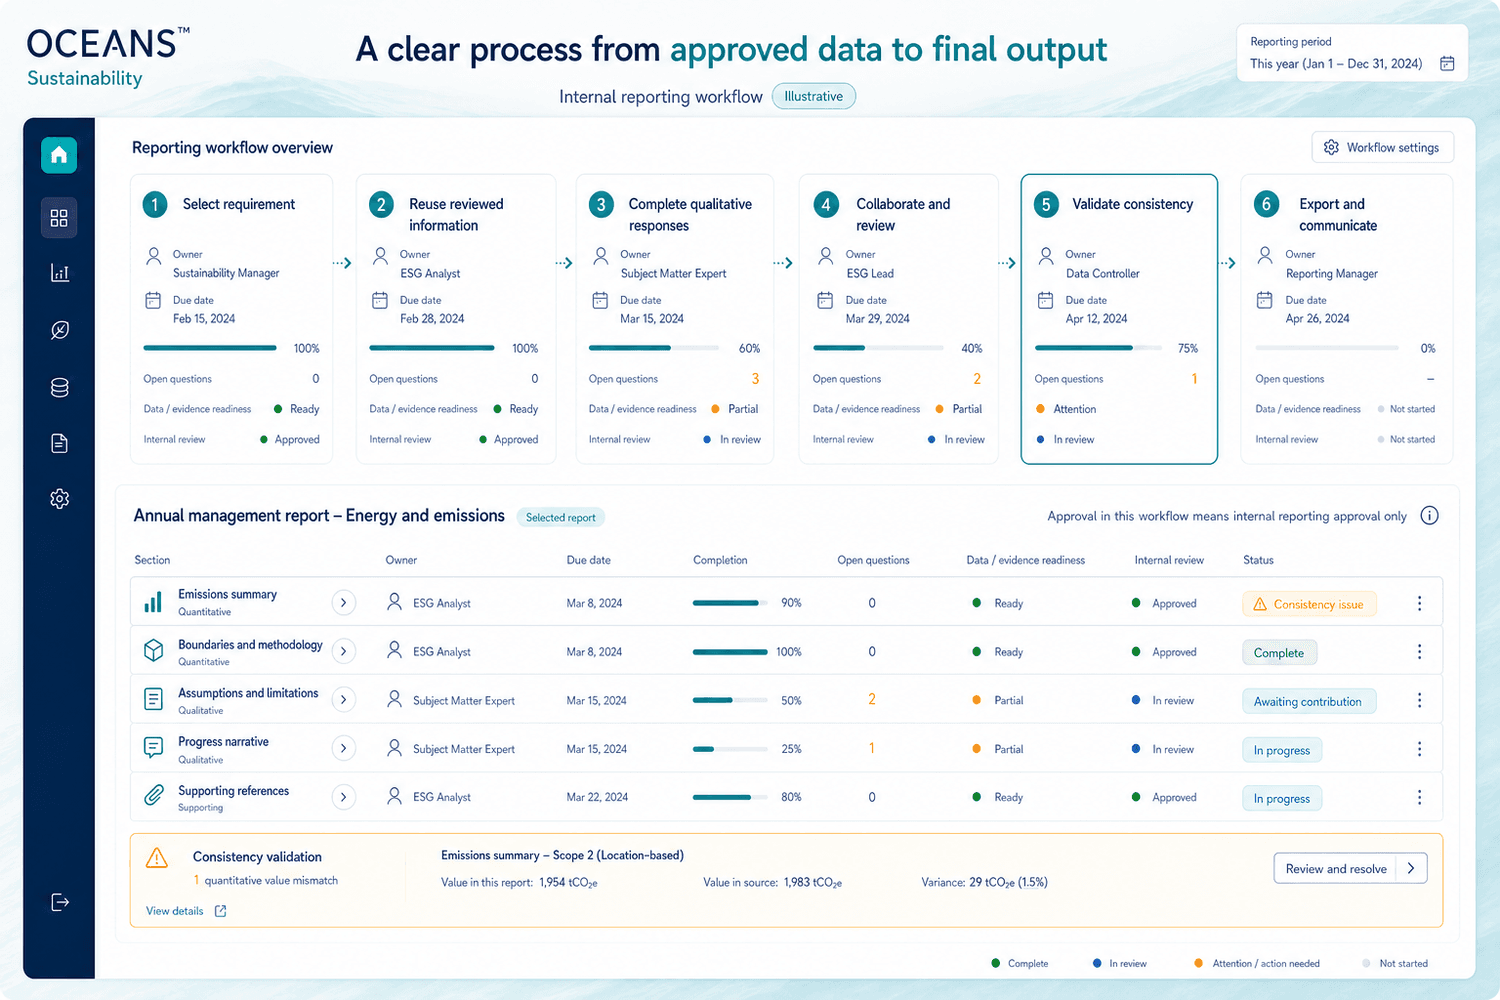
- 01
Select the reporting requirement
Audience, period, entities, metrics, and requested format.
- 02
Reuse reviewed information
Draw on maintained metrics and explanations.
- 03
Complete qualitative responses
Boundaries, methodology, assumptions, progress, and context.
- 04
Collaborate and review
Owners, contributions, questions, and changes.
- 05
Validate consistency
Compare reported values with approved calculations and evidence.
- 06
Export and communicate
Prepare information for supported internal, customer, or external use.
Approval in this workflow means internal reporting approval — not external assurance.
Prepare information for the people who need it
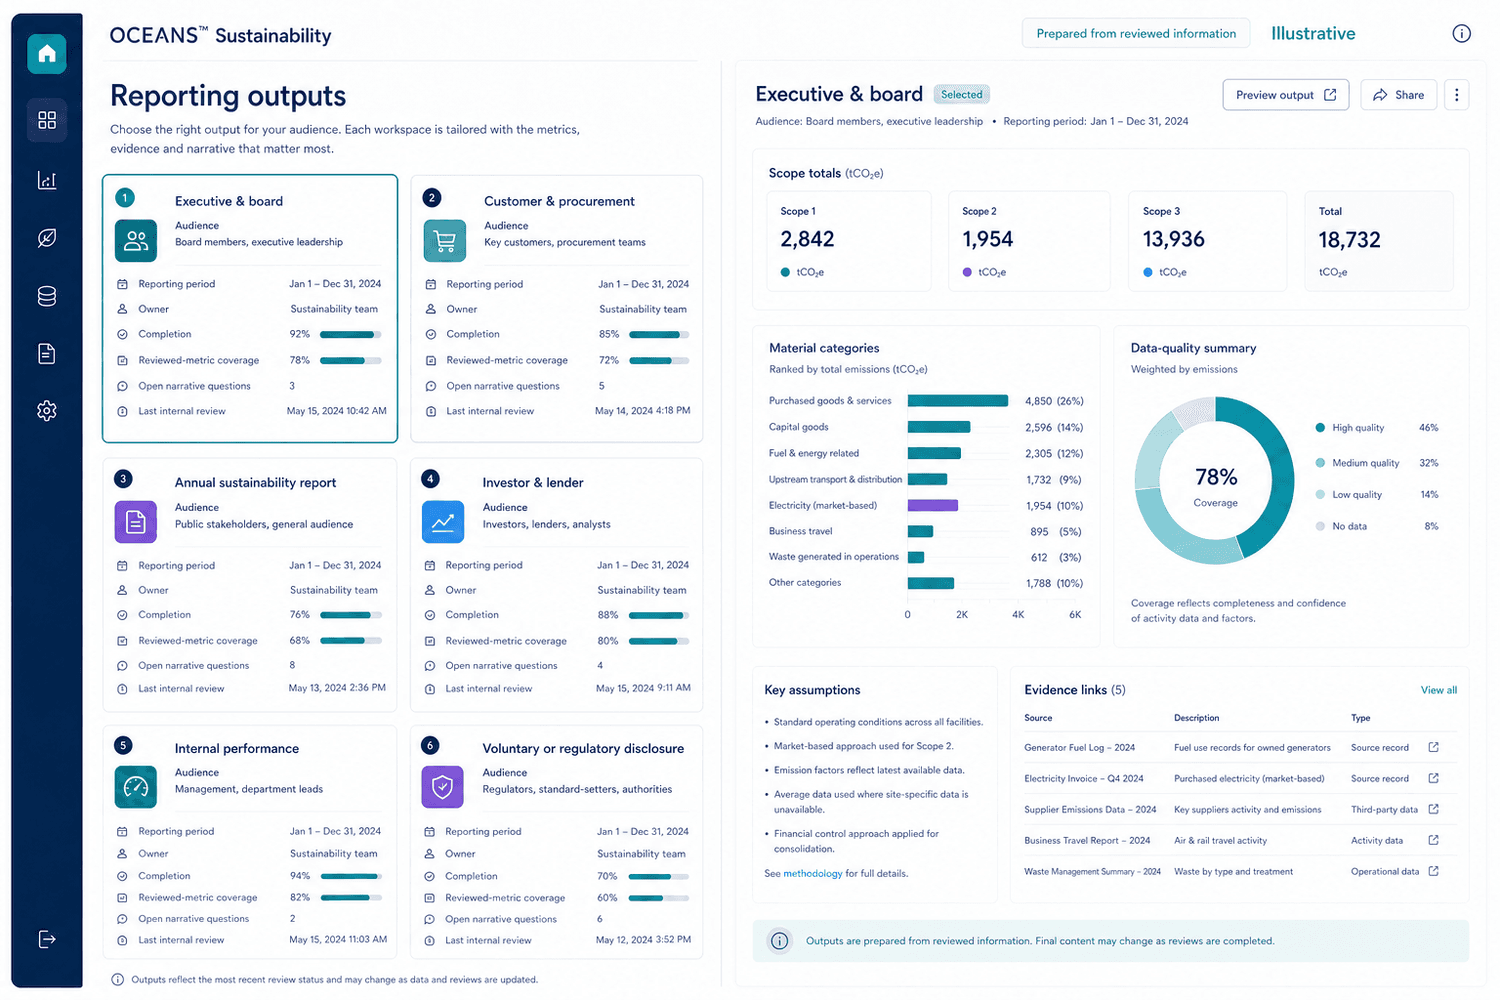
Executive and board reporting
Summarize performance for leadership and the board.
Customer and procurement requests
Respond to buyer and supply-chain questionnaires.
Annual sustainability reporting
Prepare a yearly disclosure for public stakeholders.
Investor and lender requests
Answer financing and investment due-diligence questions.
Internal performance reporting
Track progress for management and department leads.
Voluntary or regulatory disclosure preparation
Organize information ahead of a disclosure process.
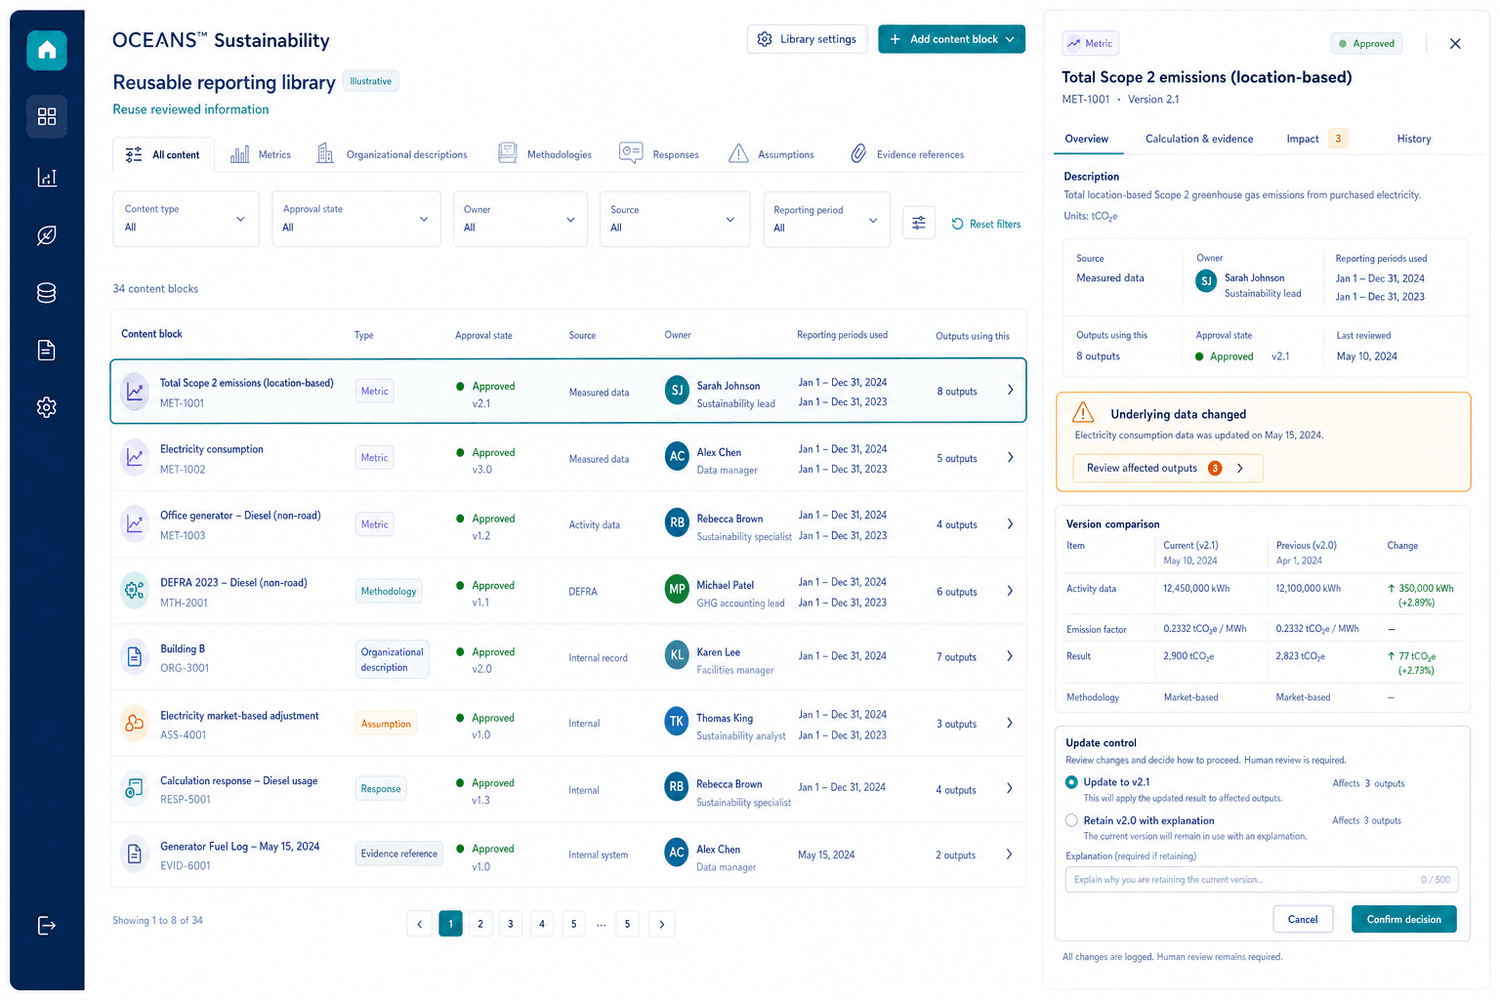
Report from a consistent, reviewed foundation
Reporting reuses approved content instead of starting over each time, including:
- Approved metrics
- Organizational descriptions
- Methodology explanations
- Responses
- Assumptions
- Evidence references
When underlying data changes, potentially affected outputs are identified so a person can review, update, or retain the prior version with an explanation.
More than emissions totals
Connect reported numbers with the context behind them
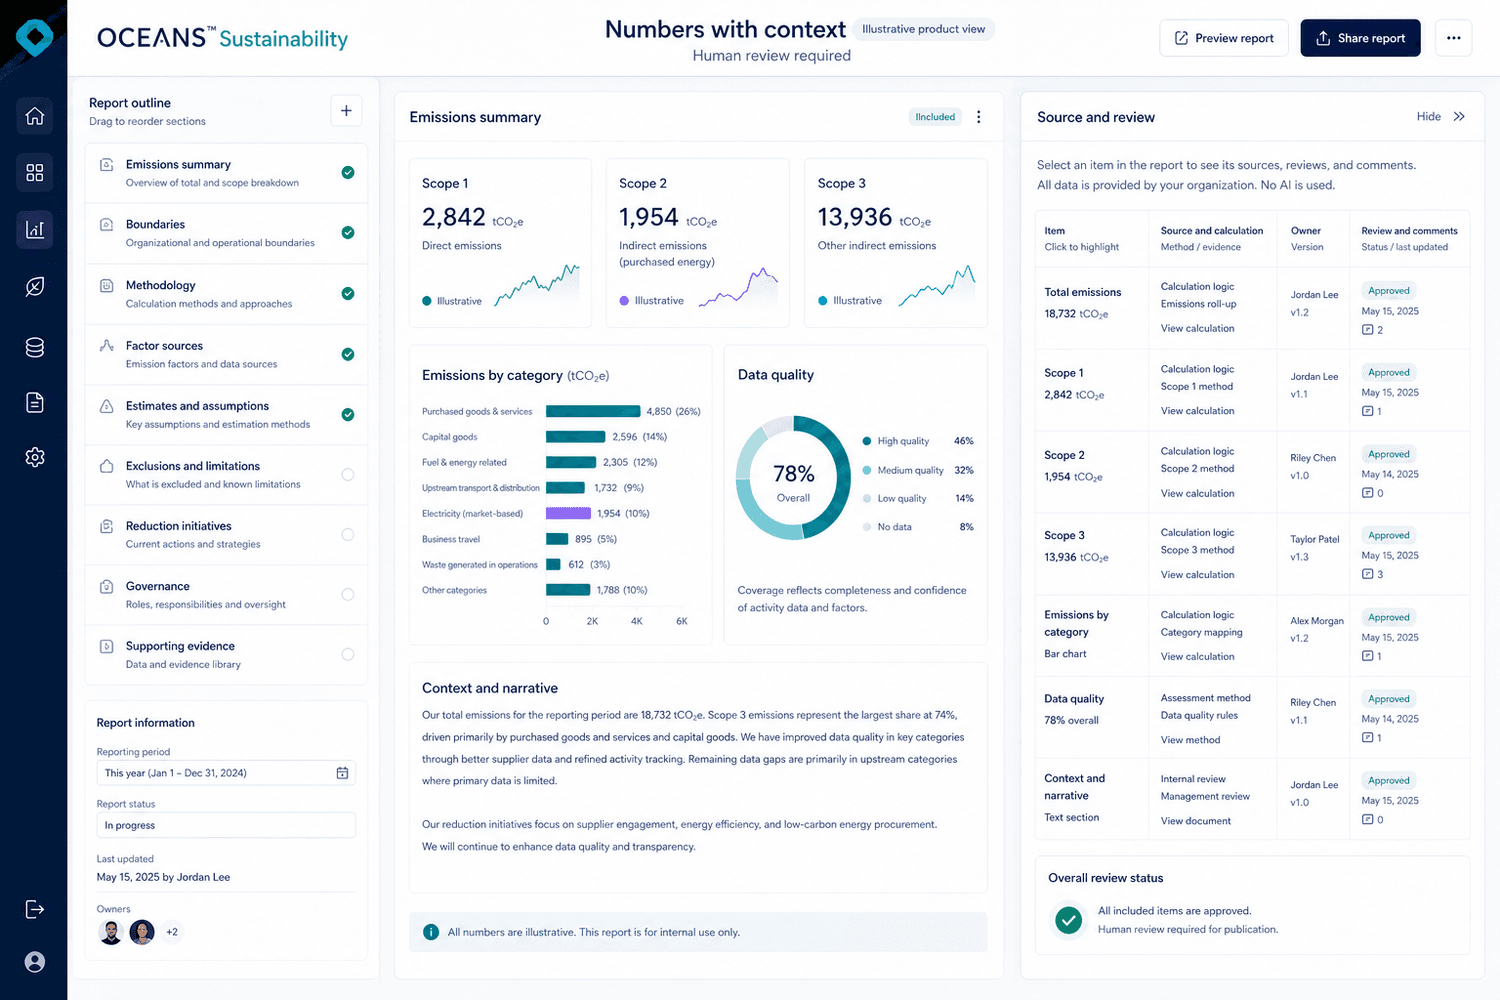
Quantitative
- Scope totals
- Category and entity breakdowns
- Period comparisons
- Data-quality indicators
Qualitative
- Boundaries
- Methodology
- Factor sources
- Assumptions, exclusions, and limitations
- Governance and responsibilities
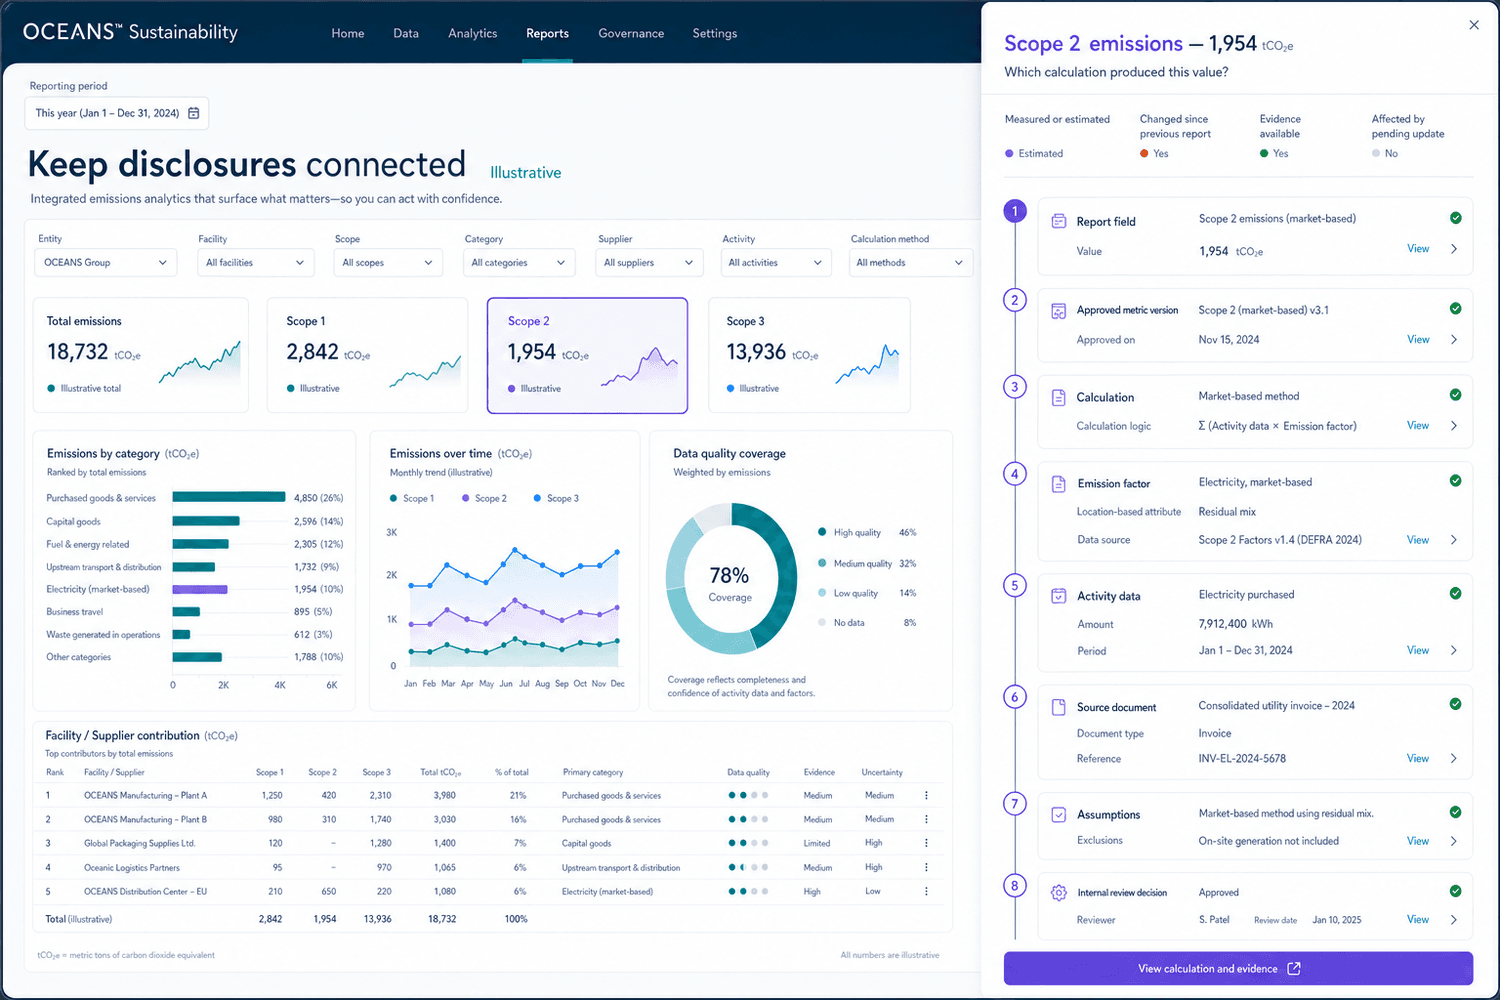
Keep disclosures connected to their underlying calculations
A selected report value can answer:
- Which calculation produced this value?
- Was the data internally reviewed?
- Which assumptions affect it?
- Is it measured or estimated?
- Has it changed since the previous report?
- Where is the supporting evidence?
This linkage supports internal review — it does not independently validate accuracy or provide assurance.
Reporting workflow
Coordinate reporting across the business
A sustainability report typically involves more teams than one:
- Finance
- Operations
- Procurement
- Legal
- Communications
- Sustainability
- Leadership
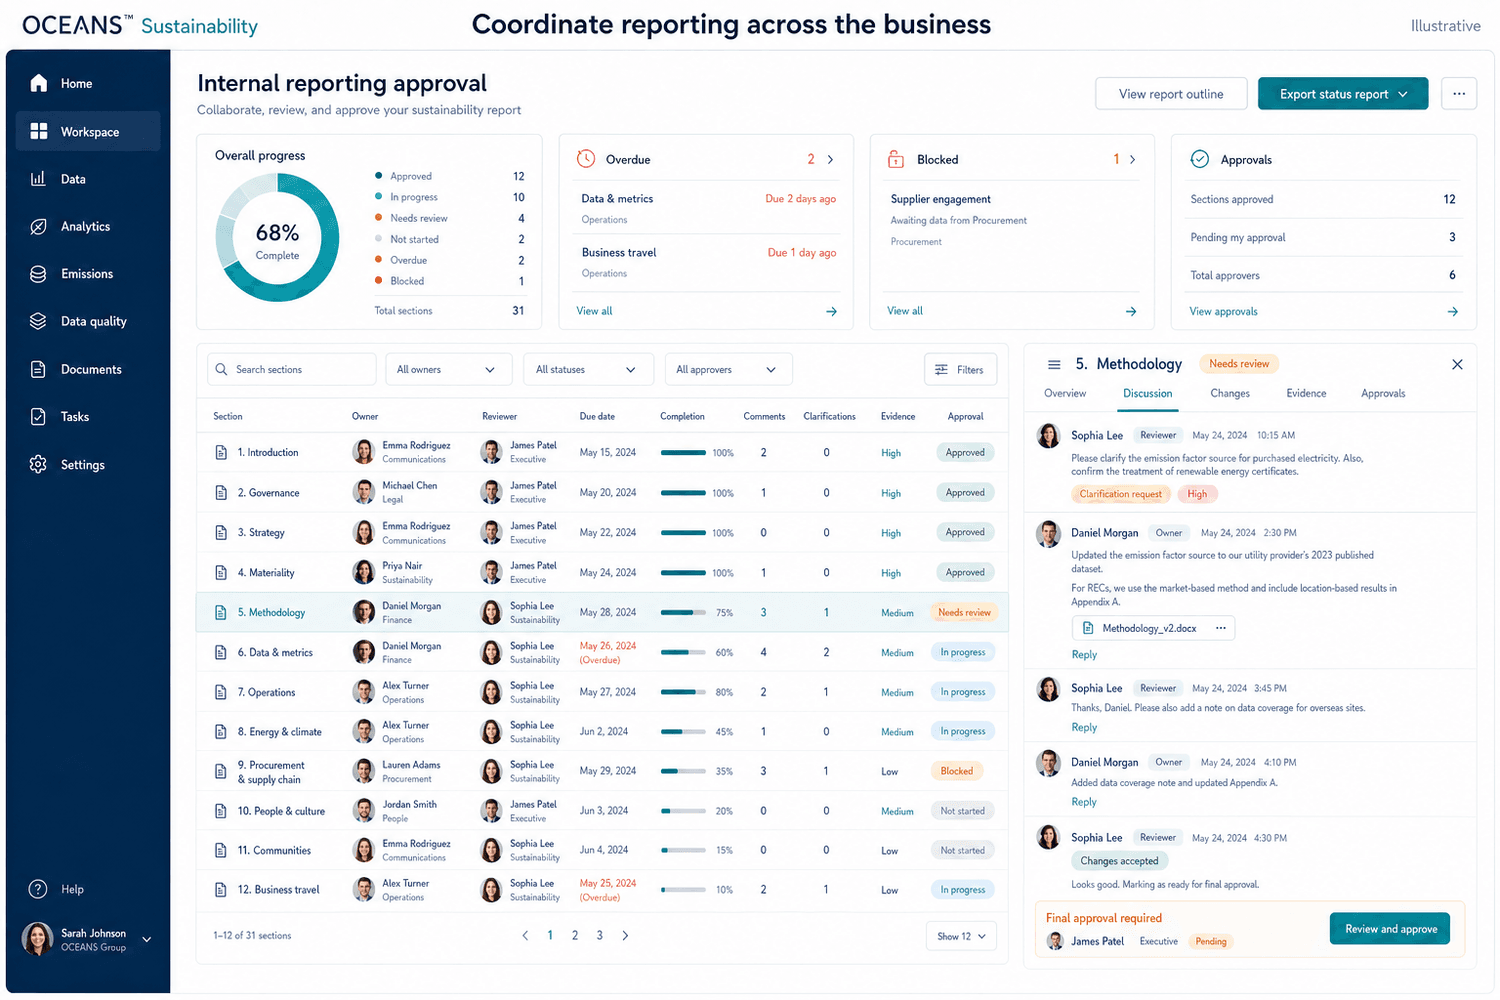
Organize one data foundation for multiple reporting needs
Different reporting requirements often request similar information in different structures — the same reviewed foundation can be organized to answer each one, without rebuilding it from scratch every time.
Reporting obligations should be reviewed with qualified legal, accounting, or sustainability advisers.
Present information in the format your stakeholders need
Possible reporting outputs include:
- Executive dashboards
- Inventory summaries
- Scope and category breakdowns
- Period comparisons
- Customer-response exports
- Data tables
- PDF summaries
- Methodology statements
- Evidence packages
The sustainability report shown earlier on this page is an illustrative desired reporting output, not a guarantee that every format above is available today.
Spend less time assembling reports—and more time improving performance
Respond faster
Draw on information that is already connected and reviewed.
Improve consistency
Answer similar questions from one reviewed foundation.
Strengthen traceability
Keep reported values connected to their calculations and evidence.
Simplify collaboration
Coordinate contributors, reviewers, and approvals in one place.
Prepare for scrutiny
Organize supporting information before a request arrives.

Build a repeatable reporting process
Discuss your reporting requirements- 01
Identify audiences and requirements
- 02
Map available metrics and evidence
- 03
Define owners and reviewers
- 04
Prepare quantitative and qualitative information
- 05
Resolve gaps and inconsistencies
- 06
Review and finalize supported outputs
Frequently asked questions
What stakeholder outputs can OCEANS™ Sustainability help prepare?
Executive and board reporting, customer and procurement questionnaire responses, annual sustainability reporting, investor and lender requests, internal performance reporting, and preparation ahead of a voluntary or regulatory disclosure process.
Does each report start from scratch?
No. Reports draw on the same reviewed metrics, explanations, and evidence references maintained in a reusable library, rather than being rebuilt from disconnected files for every new request.
What does a prepared report typically include?
An executive overview, organizational and operational boundaries, the Scope 1, 2 and 3 inventory, category/entity/period comparisons, data-quality and evidence coverage, methodology and factor sources, documented estimates and limitations, material data gaps, and governance and review context.
Can a reported value be traced back to its source after publication?
Yes. Each metric can be traced through its approved version, calculation, emission factor, activity data, source document, assumptions, and internal review status — so questions like "which calculation produced this?" or "has it changed since the last report?" have a documented answer.
Current availability
OCEANS™ Sustainability is in active product development. Access is currently limited to founding design partners — the workflow, screens, and outcomes described on this page are the design in progress, and any product screens shown are an illustrative preview of planned functionality. Guides, checklists, and the calculator elsewhere on this site are real and available now. Apply as a founding design partner to help test and shape this workflow as it is built.
Prepare credible reports from connected sustainability data
See how OCEANS™ Sustainability can help your team reuse reviewed calculations, preserve supporting evidence, and prepare consistent information for stakeholders.