REPLACE SPREADSHEET REPORTING
Replace fragile spreadsheets with a repeatable carbon-accounting process
Move carbon data, formulas, emission factors, evidence and review activity out of disconnected files and into a structured process your organization can repeat each reporting cycle.
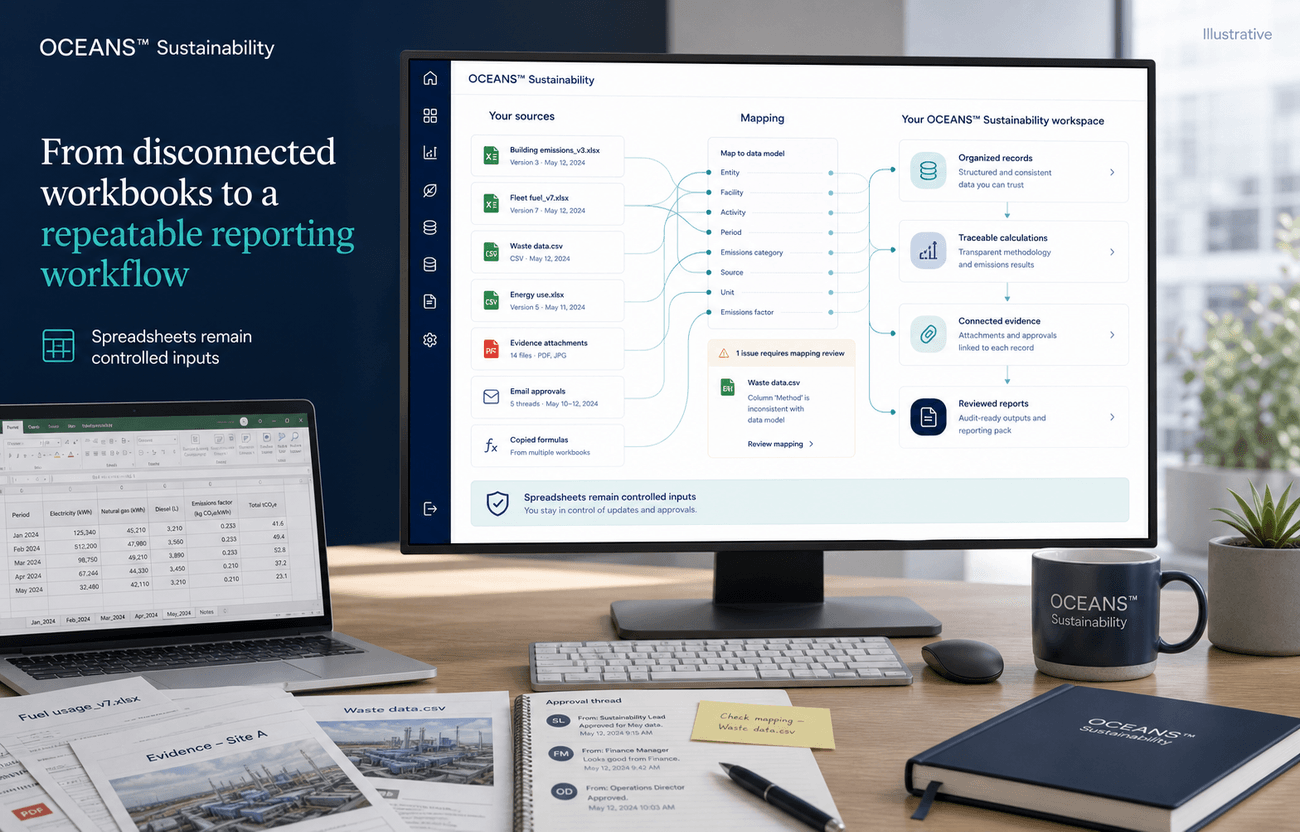
Keep the flexibility of your existing data. Remove version confusion, hidden formulas, and repetitive reporting work.
See how OCEANS™ Sustainability works- Files and records
- Structured data
- Traceable calculations
- Reviewed information
Spreadsheets help you start. They become harder to trust as you grow.
These are common warning signs worth reviewing — not a universal accusation, and not an accuracy, audit, security, or compliance verdict.
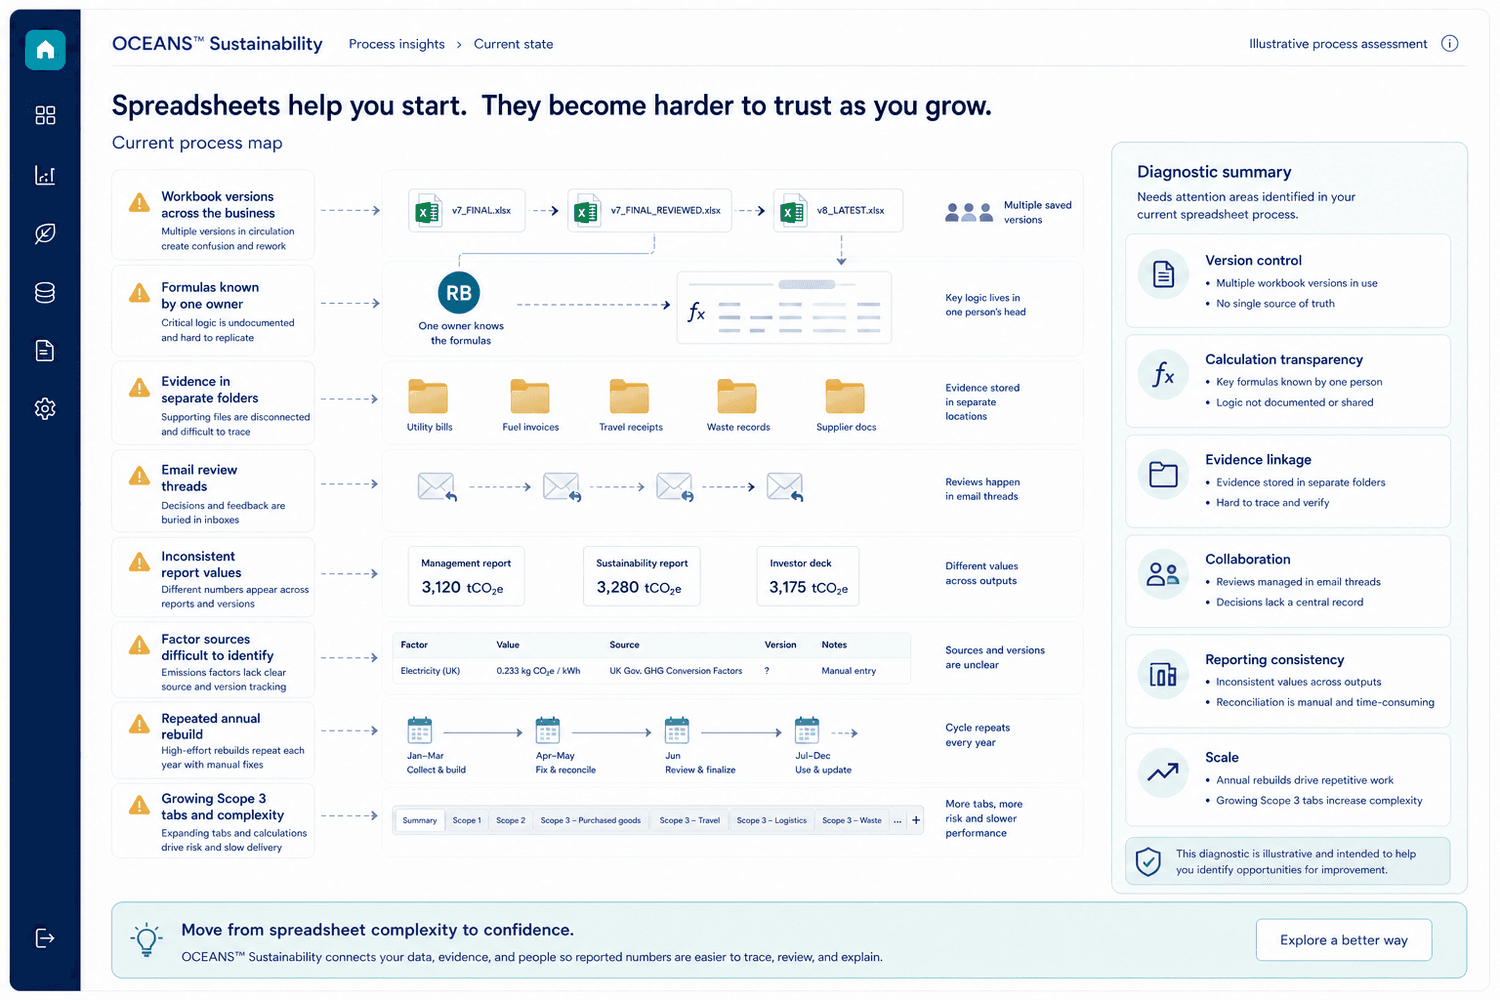
Areas to review
- More than one version of the same reporting workbook is in circulation
- Key calculations depend on formulas only one or two people understand
- Supporting evidence for a number lives in a different folder or inbox
- Values have been overwritten without a record of the previous figure
- Emission factors are applied inconsistently across worksheets
- Reporting workbooks are rebuilt largely from scratch each year
- Outputs sent to different stakeholders don’t always match
- Review happens mostly through email threads and file comments
- Scope 3 data collection has outgrown what a workbook can manage
- It’s difficult to explain how a specific number was calculated after the fact
Who it is for
For teams that have outgrown spreadsheet-based carbon accounting
Already calculating some emissions
Some Scope 1, 2, or 3 emissions are already tracked, usually in spreadsheets.
Collecting from multiple teams
Data comes from more than one team, facility, or business unit.
Receiving recurring requests
Customers, investors, or internal stakeholders ask for updated figures regularly.
Wanting repeatability
Looking for a process that can be reused next cycle, not rebuilt each time.
Without a heavy implementation
Interested in more structure without a large enterprise rollout.
Relevant stakeholders often include:
Your spreadsheets do not have to disappear overnight
Workbooks and CSVs can remain inputs where appropriate, while OCEANS™ Sustainability becomes the connected environment for organization, calculation, review, evidence, and reporting. Existing records can be mapped as part of a migration process — this page does not claim automatic import.
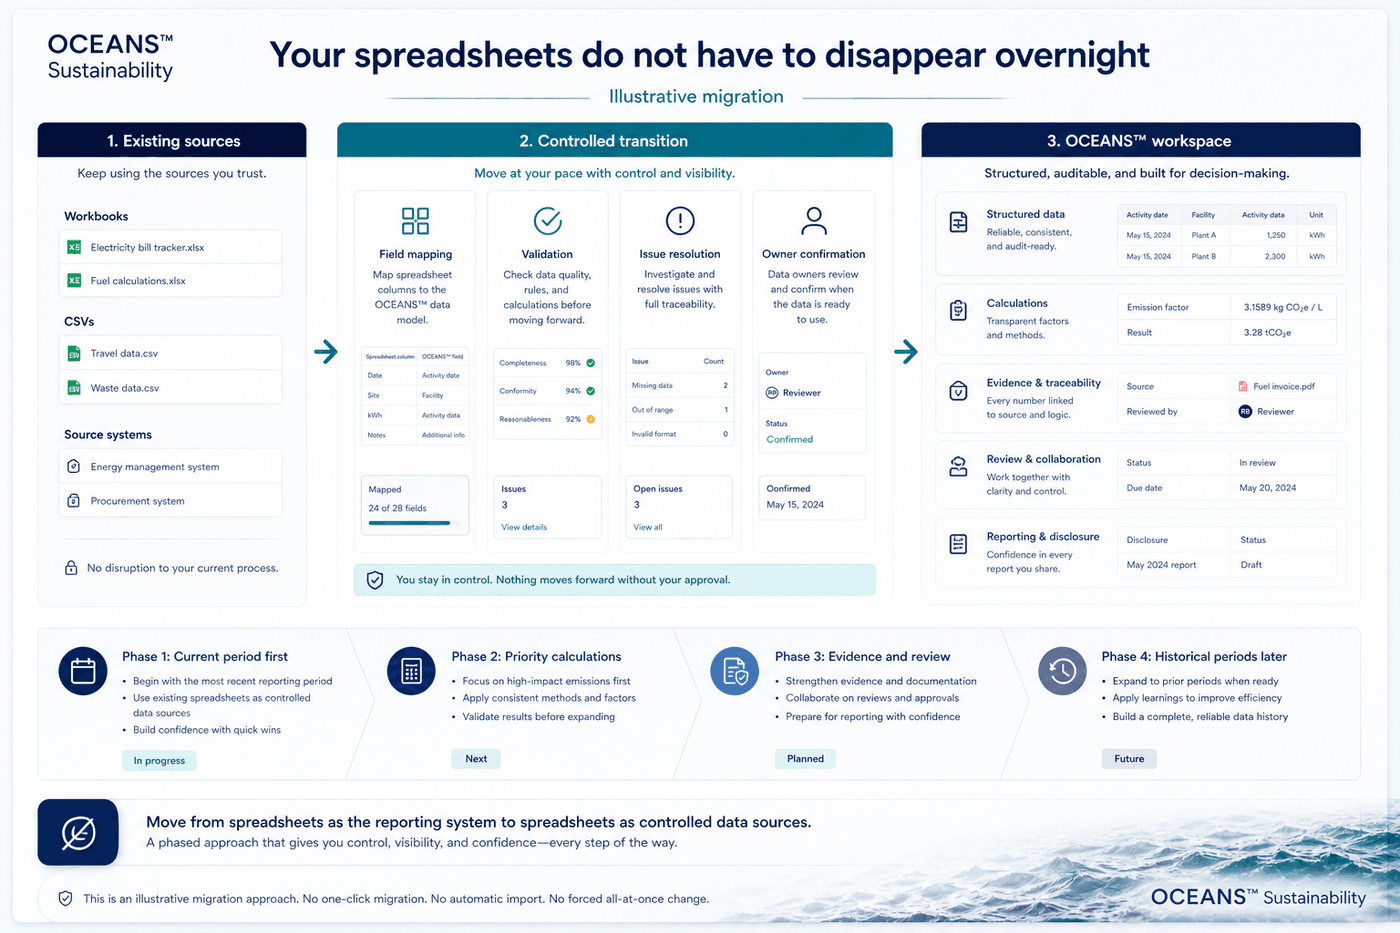
Move from spreadsheets as the reporting system to spreadsheets as controlled data sources.
How it works
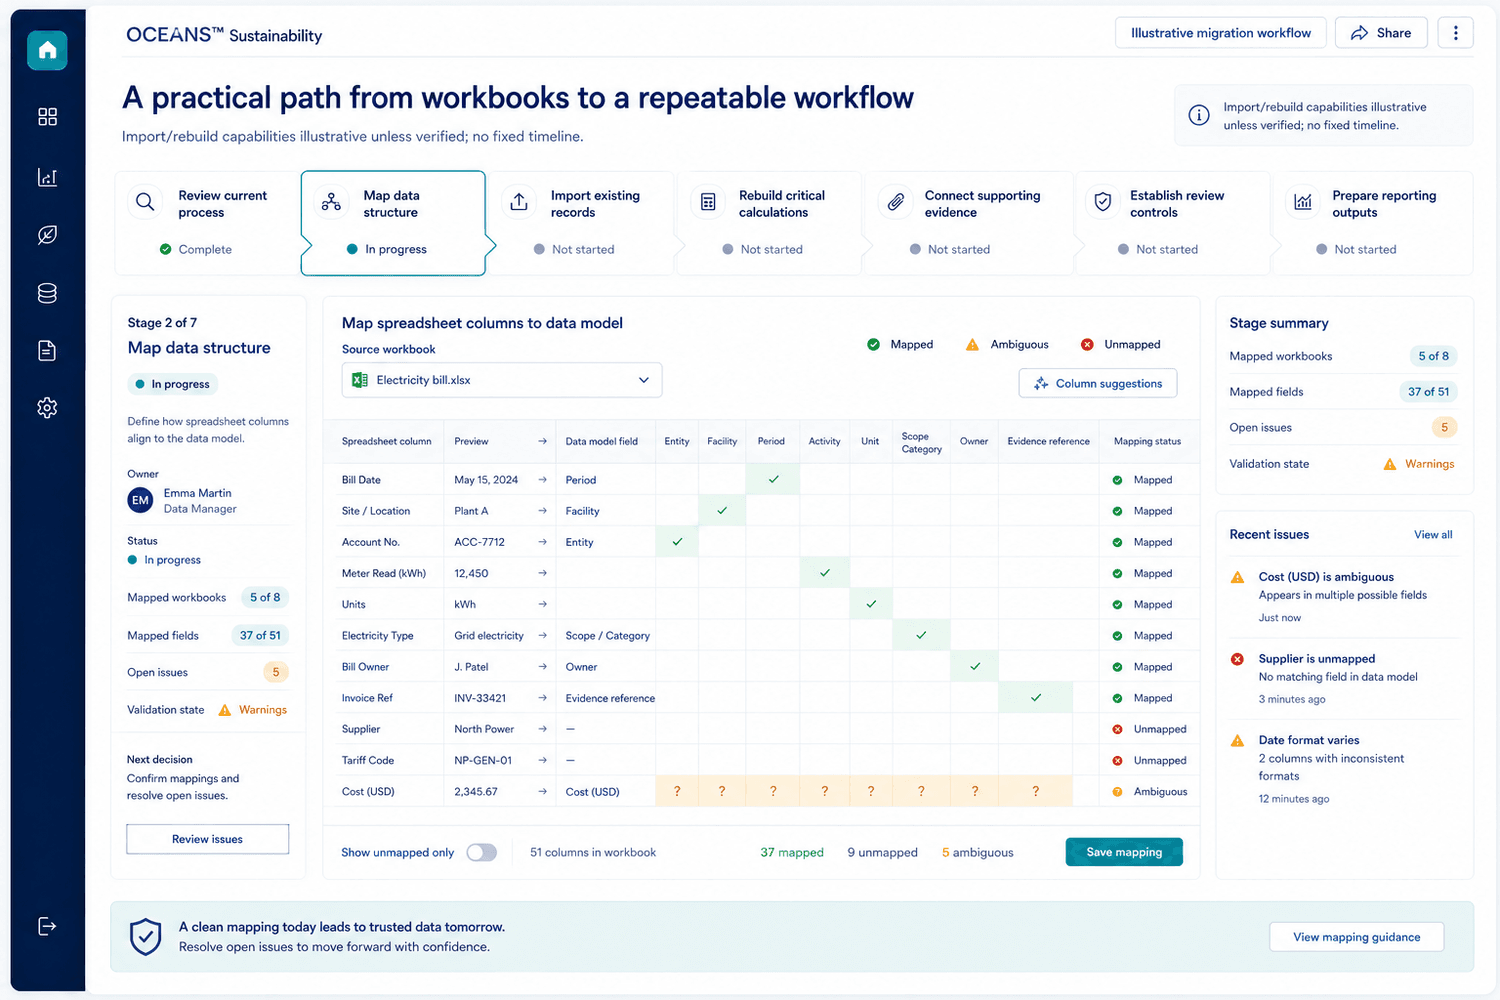
A practical path from workbooks to a repeatable workflow
- 01
Review current process
Understand today’s workbooks, contributors, and reporting outputs.
- 02
Map data structure
Align existing fields to a common entity, period, and category structure.
- 03
Import supported existing records
Bring in current data that can be mapped as part of the migration.
- 04
Rebuild critical calculations
Review and document the calculation logic that matters most.
- 05
Connect supporting evidence
Link source documents to the records and calculations they support.
- 06
Establish review controls
Define who reviews and approves information before it is reused.
- 07
Prepare supported reporting outputs
Produce reviewed information for the outputs your organization needs.
Ambiguous or unmapped fields, validation issues, and open owner questions are surfaced along the way — migration is a guided, phased process, not automatic schema inference or a fixed duration.
Replace fragile files with a connected reporting process
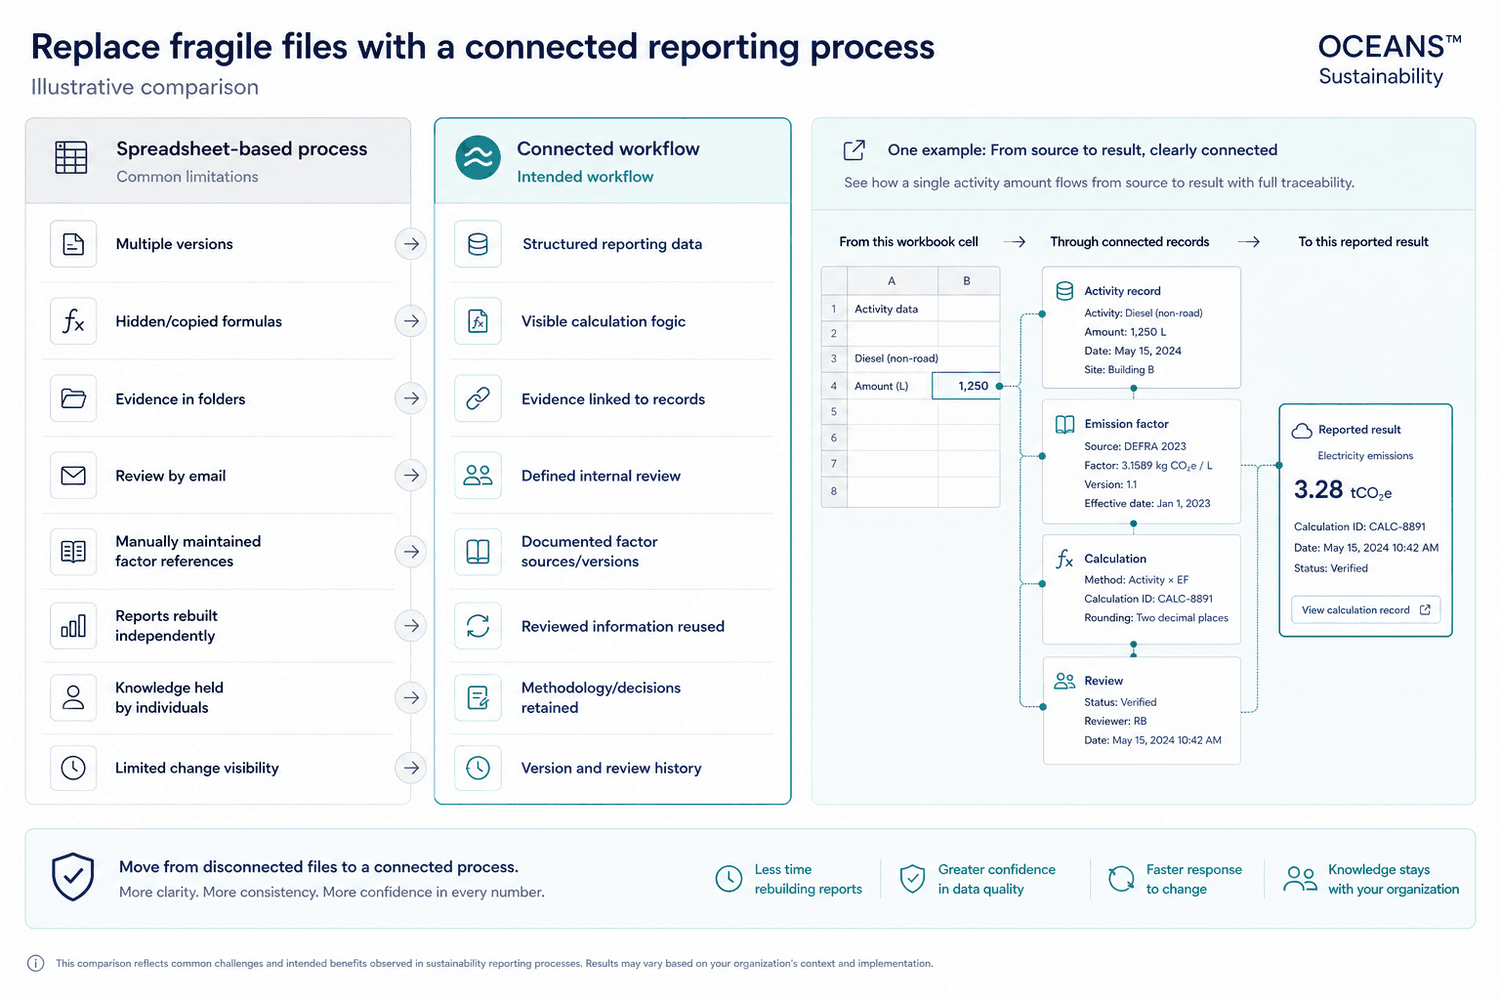
| Common spreadsheet limitation | With OCEANS™ Sustainability |
|---|---|
| Multiple workbook versions in circulation | One structured set of reporting data |
| Copied or hidden formulas | Visible, documented calculation logic |
| Evidence stored in separate folders | Evidence linked directly to each record |
| Review conducted over email | A defined internal review step |
| Emission factors referenced manually | Documented factor source and version |
| Reports rebuilt independently each time | Reviewed information reused across outputs |
| Calculation knowledge held by one person | Methodology and decisions retained in the workflow |
| Limited visibility into what changed | Version and review context kept with the data |
"Verified" in an illustrative image refers to internal review status, not independent verification.
Structured data
Bring consistency to information from different teams
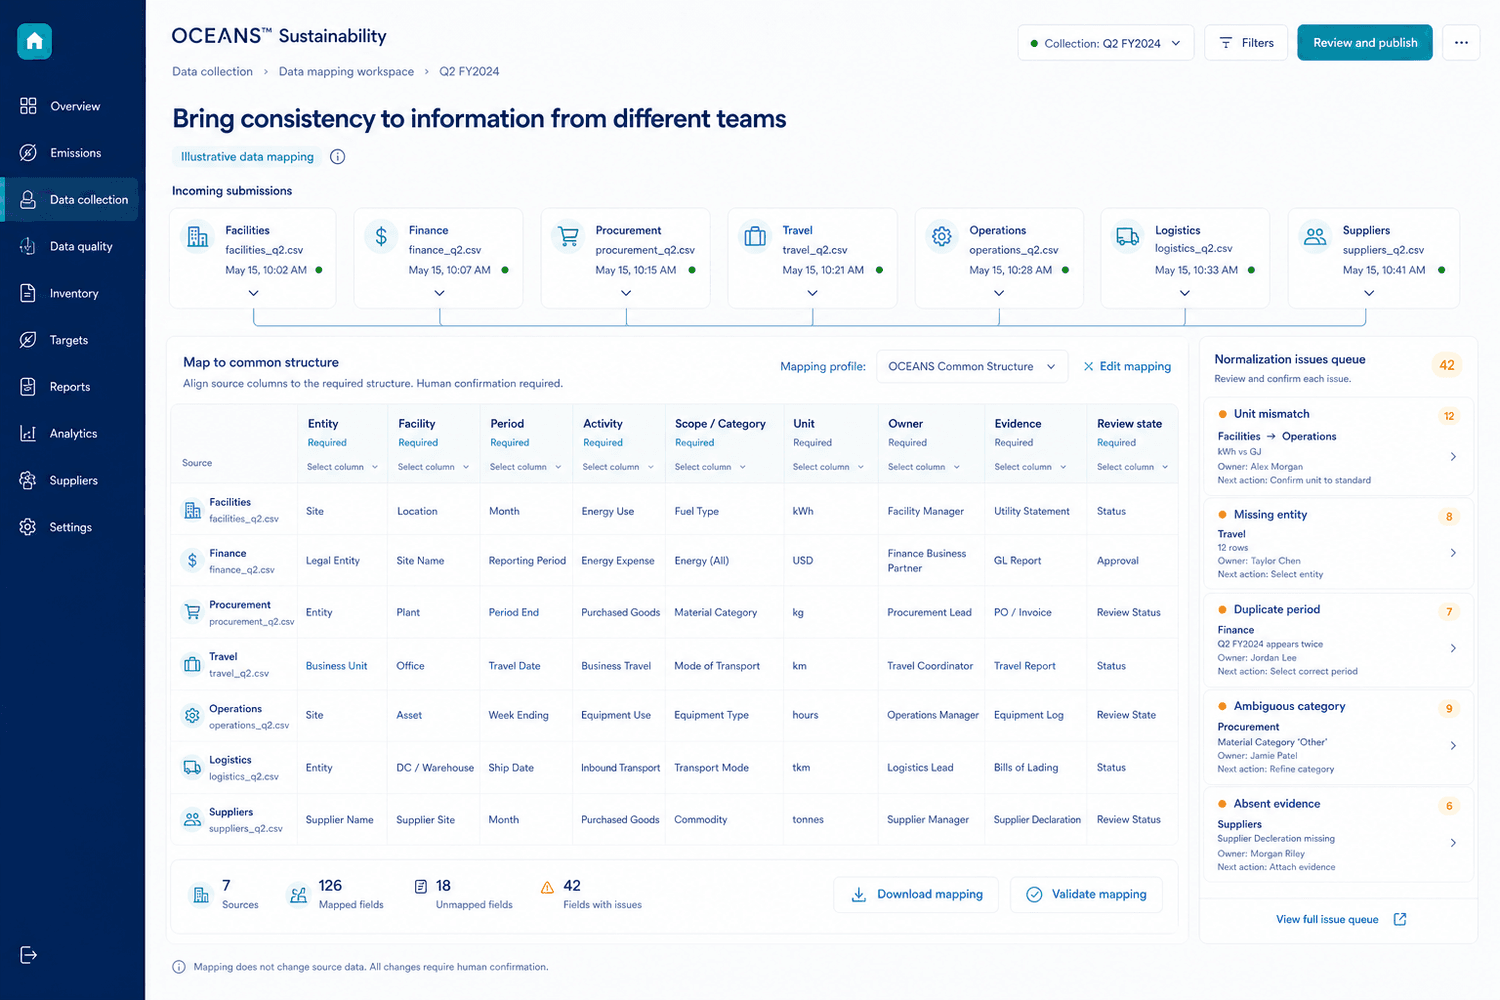
A common structure
Flagged for human review
Structure and issue flags support human review — records are not automatically normalized, validated, or modified without confirmation.
Explore Connect DataMake calculation logic easier to understand
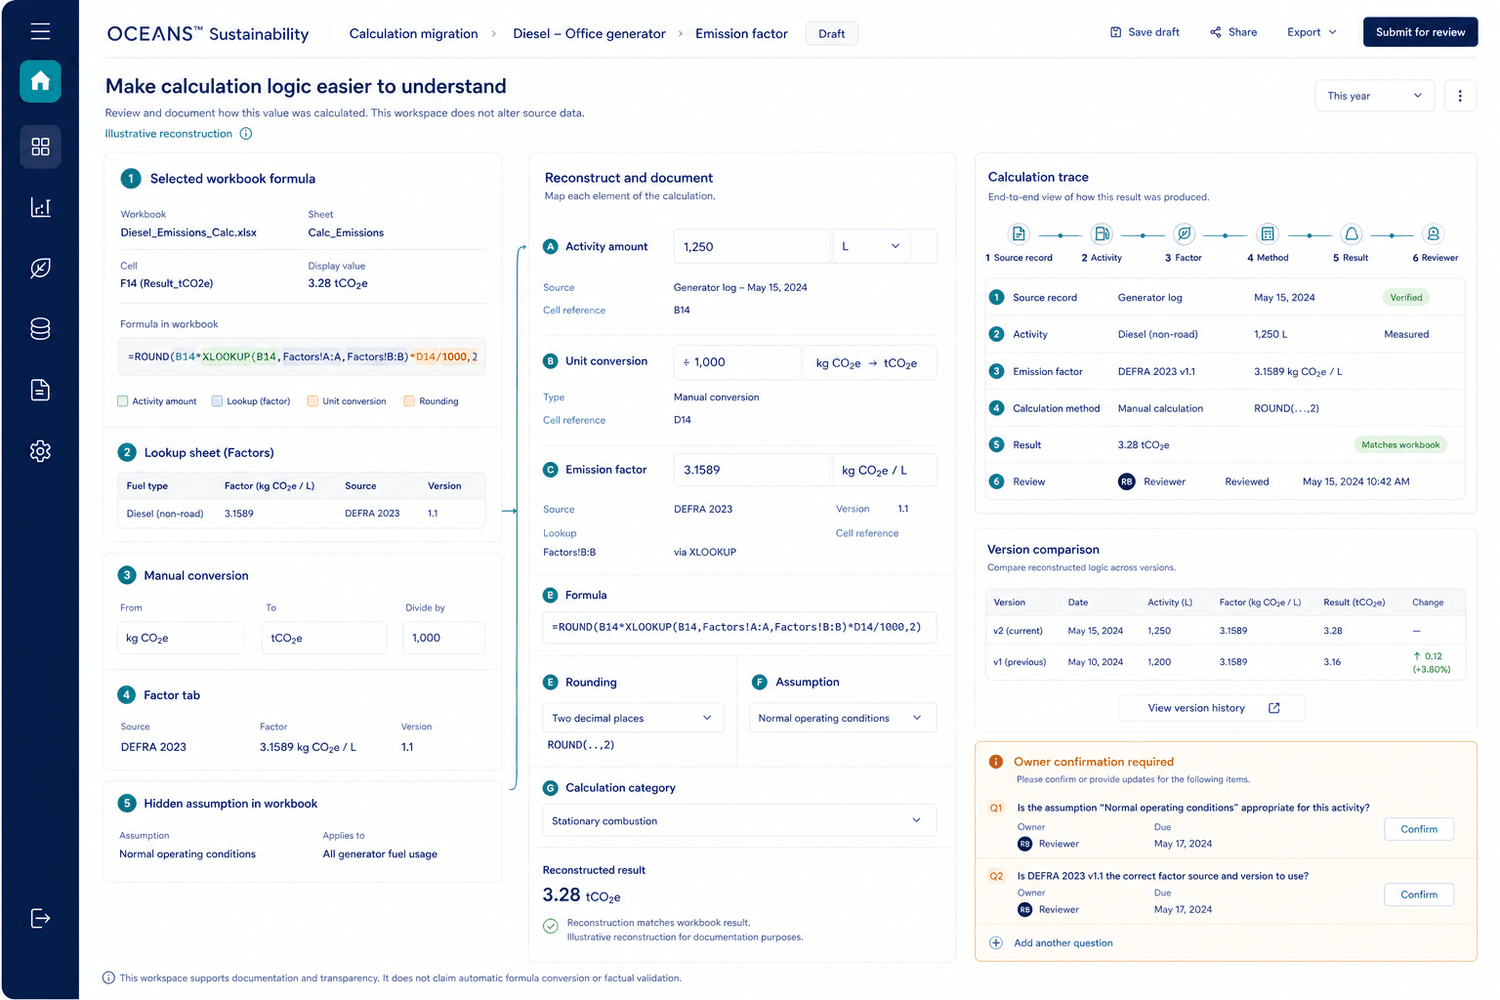
Relevant spreadsheet logic may be reviewed and documented — not automatically converted or factually validated. Owner questions and unresolved assumptions stay visible rather than hidden.
Explore Calculate EmissionsKeep the evidence with the number
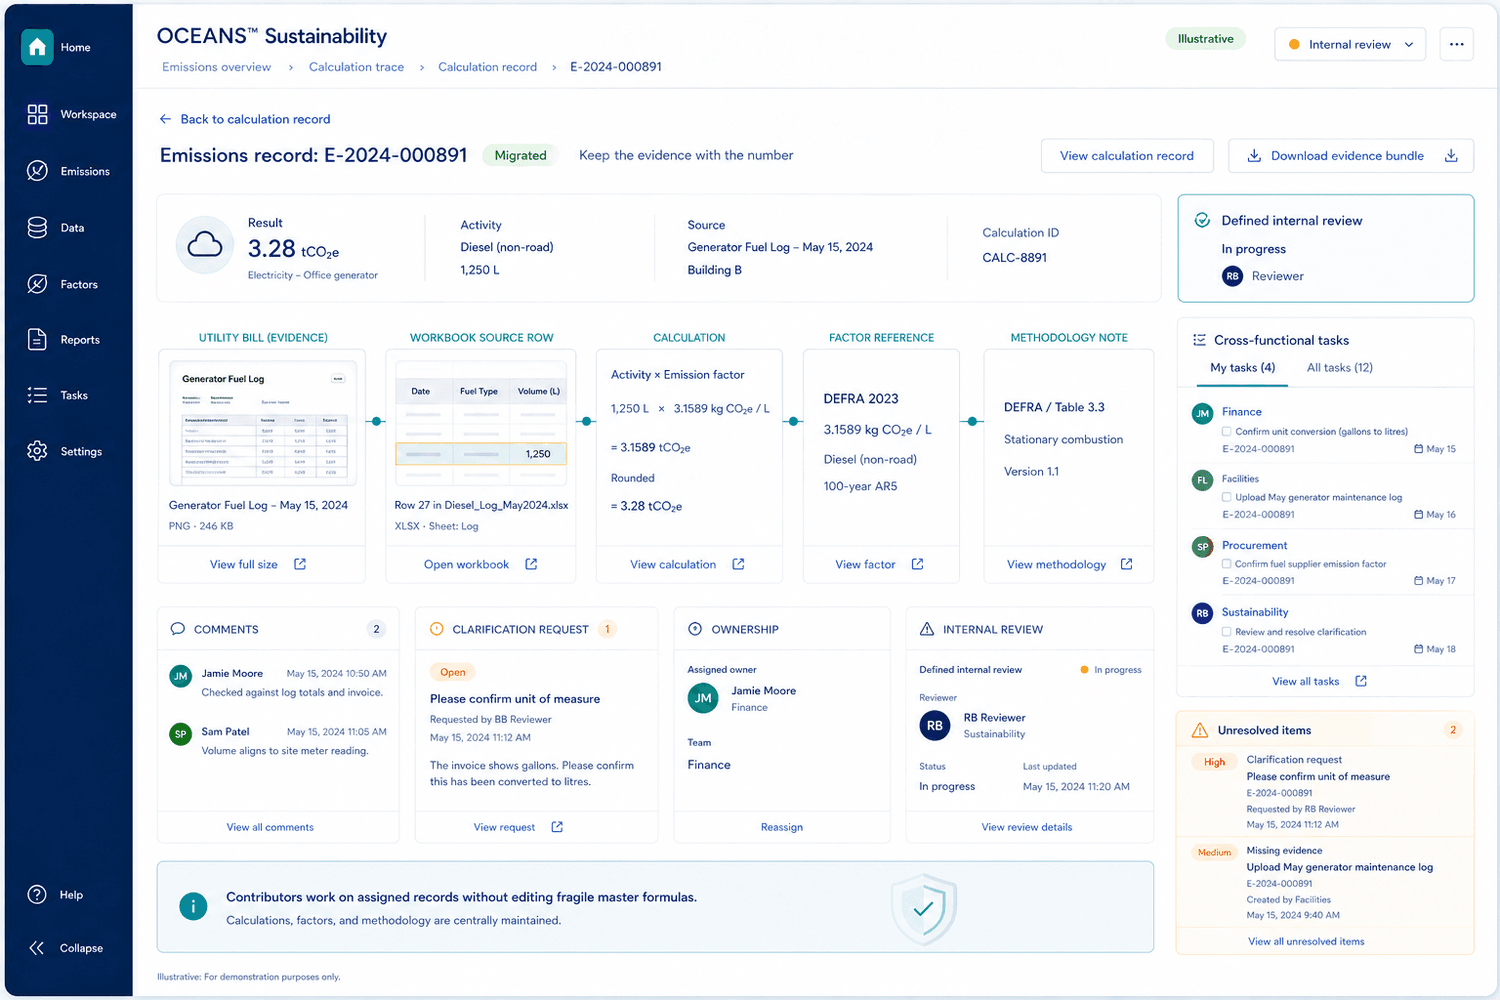
Any download bundle, document preview, assignment, comment, or approval control shown is illustrative unless verified for your deployment. Internal review is not independent assurance.
Explore Evidence and TraceabilityCross-functional workflow
Give contributors clear responsibilities without sharing one fragile workbook
Clear ownership
Entities and categories can be assigned to a responsible contributor.
Period tracking
Progress is visible by reporting period rather than by inbox.
Clarification requests
Open questions stay attached to the record they concern.
Notes and context
Explanations are kept with the data instead of a side conversation.
Unresolved items
Outstanding issues remain visible until they are addressed.
Internal decisions
Review decisions are recorded rather than only remembered.
Described here as a guided workflow — responsibility for decisions and data remains with your organization.
Reuse reviewed information across reporting needs
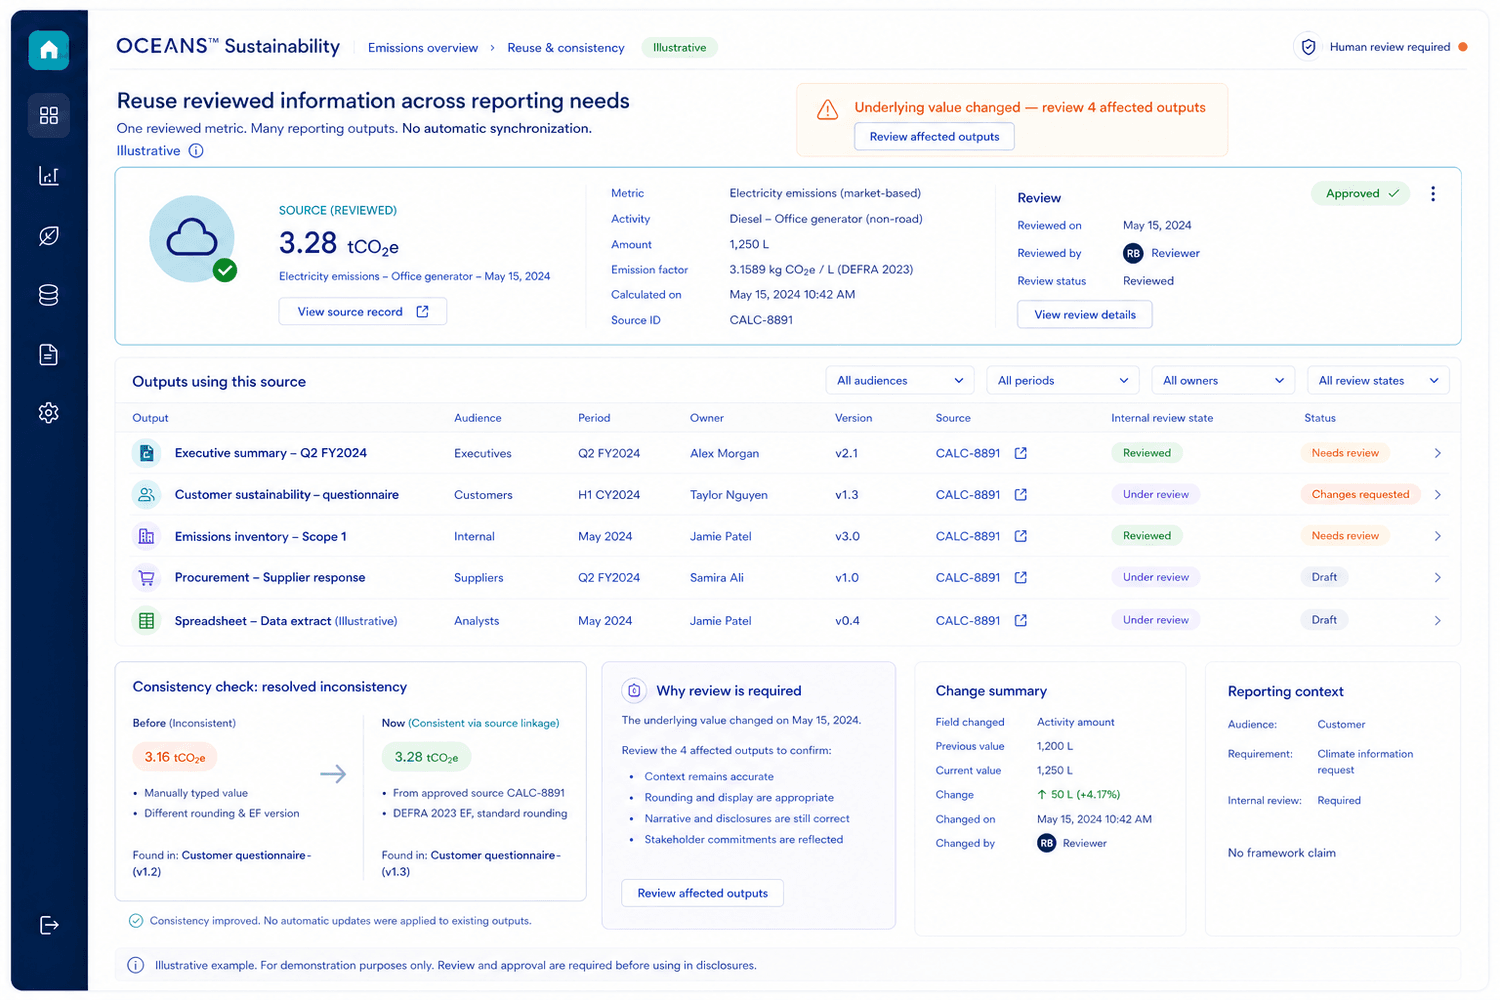
If underlying information changes, affected outputs are surfaced for human review — information is never silently synchronized.
Explore Prepare ReportsSpend less time maintaining files and more time using the information
Reduce repetitive work
Spend less time rebuilding the same information for each reporting cycle.
Improve consistency
Reduce the chance that different outputs quietly disagree with each other.
Preserve knowledge
Keep calculation logic and decisions with the workflow, not one person.
Strengthen traceability
Make it easier to connect a reported number back to its source.
Support growth
Add entities, categories, and contributors without starting over.
Improve review readiness
Keep documentation and evidence organized as scrutiny increases.
Move at a pace that fits your organization
An example sequence — priorities depend on your organization's data, deadlines, and objectives.
- 1 Current-period Scope 1 & 2
- 2 Priority Scope 3 categories
- 3 Supporting evidence
- 4 Internal review
- 5 Selected historical data
- 6 Additional reporting outputs
The goal is to establish a more reliable process — not create another disruptive technology project.

Why OCEANS™ Sustainability
Structured software with hands-on migration support
Practical migration
A phased path from workbooks to a connected workflow, not an all-at-once switch.
Guided implementation
Hands-on support planning your specific migration, not a self-serve import.
Transparent calculations
Calculation logic stays visible and documented as it moves off spreadsheets.
Connected evidence
Supporting records travel with the data they support.
Built for lean teams
Designed for organizations without a large sustainability department.
Your organization retains responsibility for decisions and data. This is not a legal, audit, assurance, or certification claim.
Have you outgrown spreadsheet reporting?
An optional self-assessment. Your selections stay in this browser tab only and are not saved or sent anywhere.
0 of 10 selected. Select any statements that sound familiar.
Assess your current processFrequently asked questions
Where to go next
Current availability
OCEANS™ Sustainability is in active product development. Access is currently limited to founding design partners — the workflow, screens, and outcomes described on this page are the design in progress, and any product screens shown are an illustrative preview of planned functionality. Guides, checklists, and the calculator elsewhere on this site are real and available now. Apply as a founding design partner to help test and shape this workflow as it is built.
Turn your spreadsheet process into a system your team can repeat
Show us how you currently collect data, calculate emissions, and prepare reports. We will help identify the highest-value opportunities for creating a more structured workflow. Begin with a focused review of your current files, calculations, contributors, and reporting requirements.