FIRST CARBON BASELINE
Build your first carbon baseline without building a large sustainability team
Create an initial Scope 1 and Scope 2 inventory, identify relevant Scope 3 categories, document data gaps and establish a carbon-accounting process your team can improve over time.
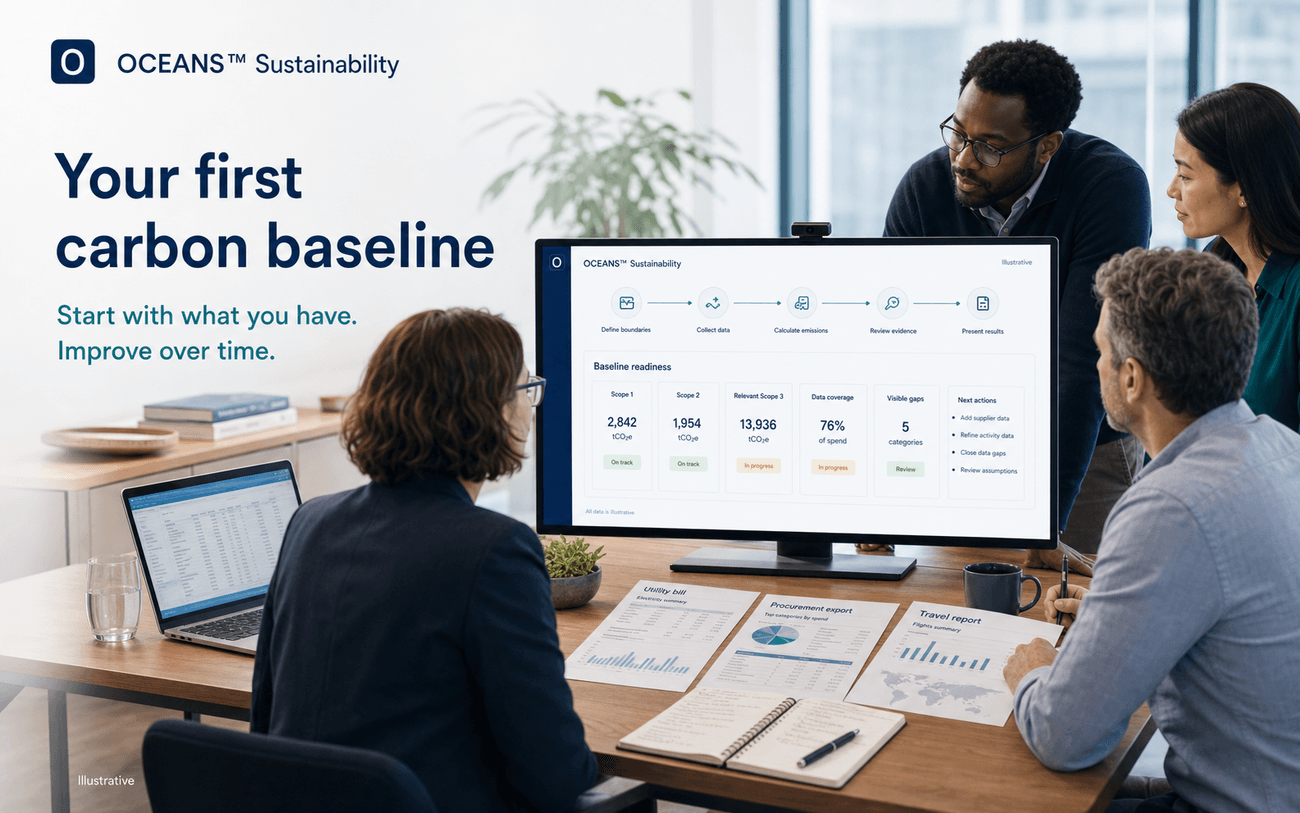
Start with the data you have. Document what is missing. Improve with every reporting cycle.
See how OCEANS™ Sustainability works- Define boundaries
- Collect data
- Calculate emissions
- Review evidence
- Present results
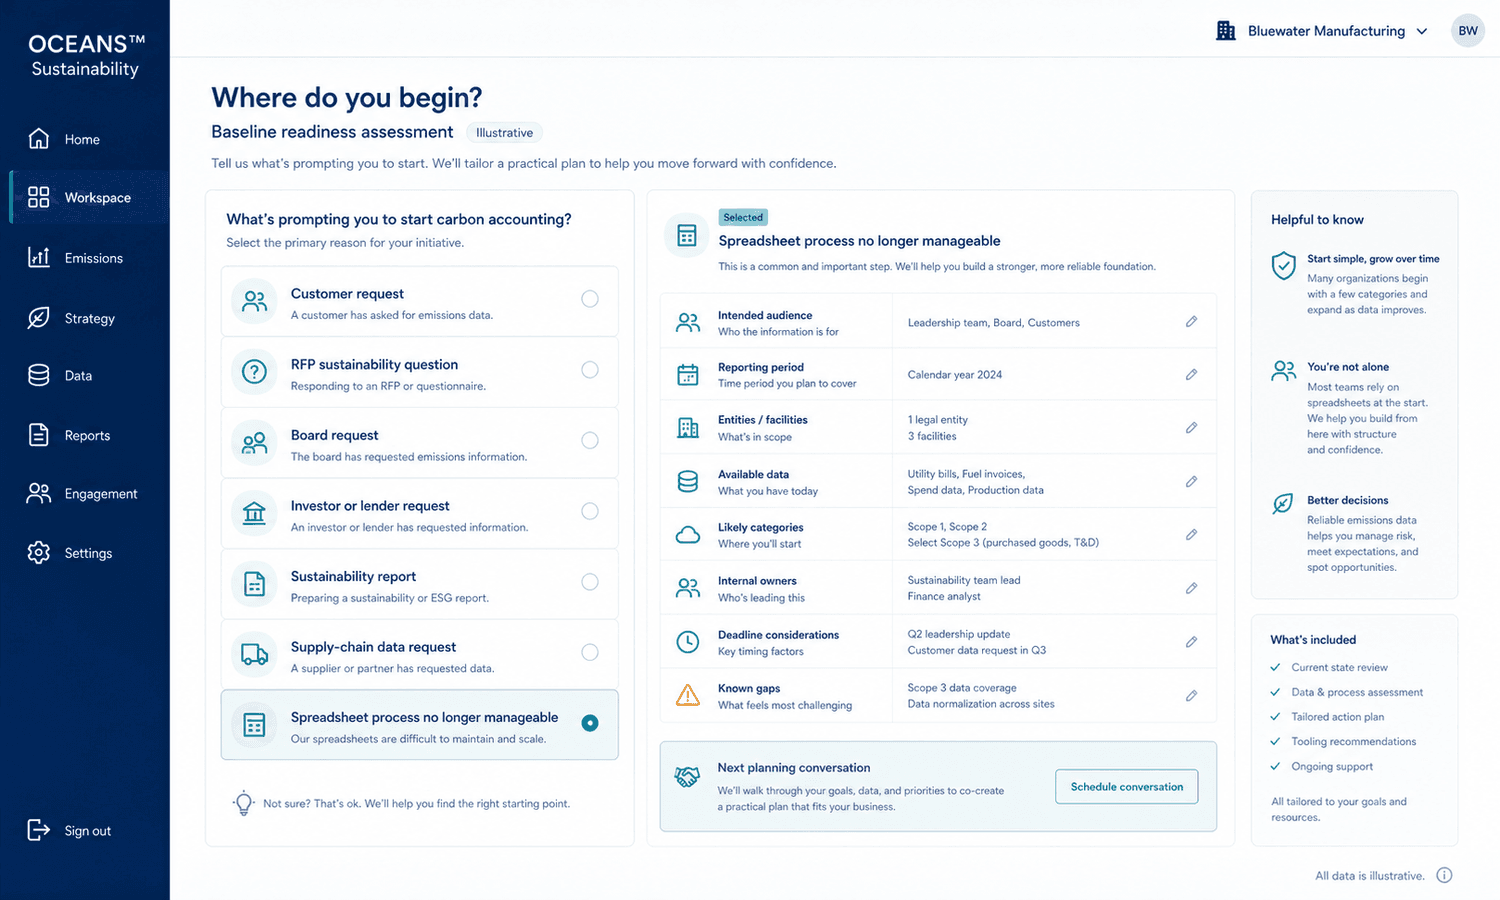
Your company is being asked for emissions information. Where do you begin?
The request might come from a customer, an RFP, leadership, an investor or lender, a reporting need, or a supply-chain partner. Wherever it started, it becomes a practical planning conversation.
Who it is for
Designed for companies beginning their carbon-accounting journey
Calculating for the first time
No existing emissions inventory to build from.
Data spread across departments
Records live with finance, facilities, operations, and others.
A lean or part-time team
No dedicated sustainability department, or a very small one.
Needing help identifying sources
Unsure which records and categories actually matter.
Wanting repeatability
Looking for a process to reuse, not a one-time spreadsheet.
Needing explainable results
A baseline that can be defended when someone asks about it.
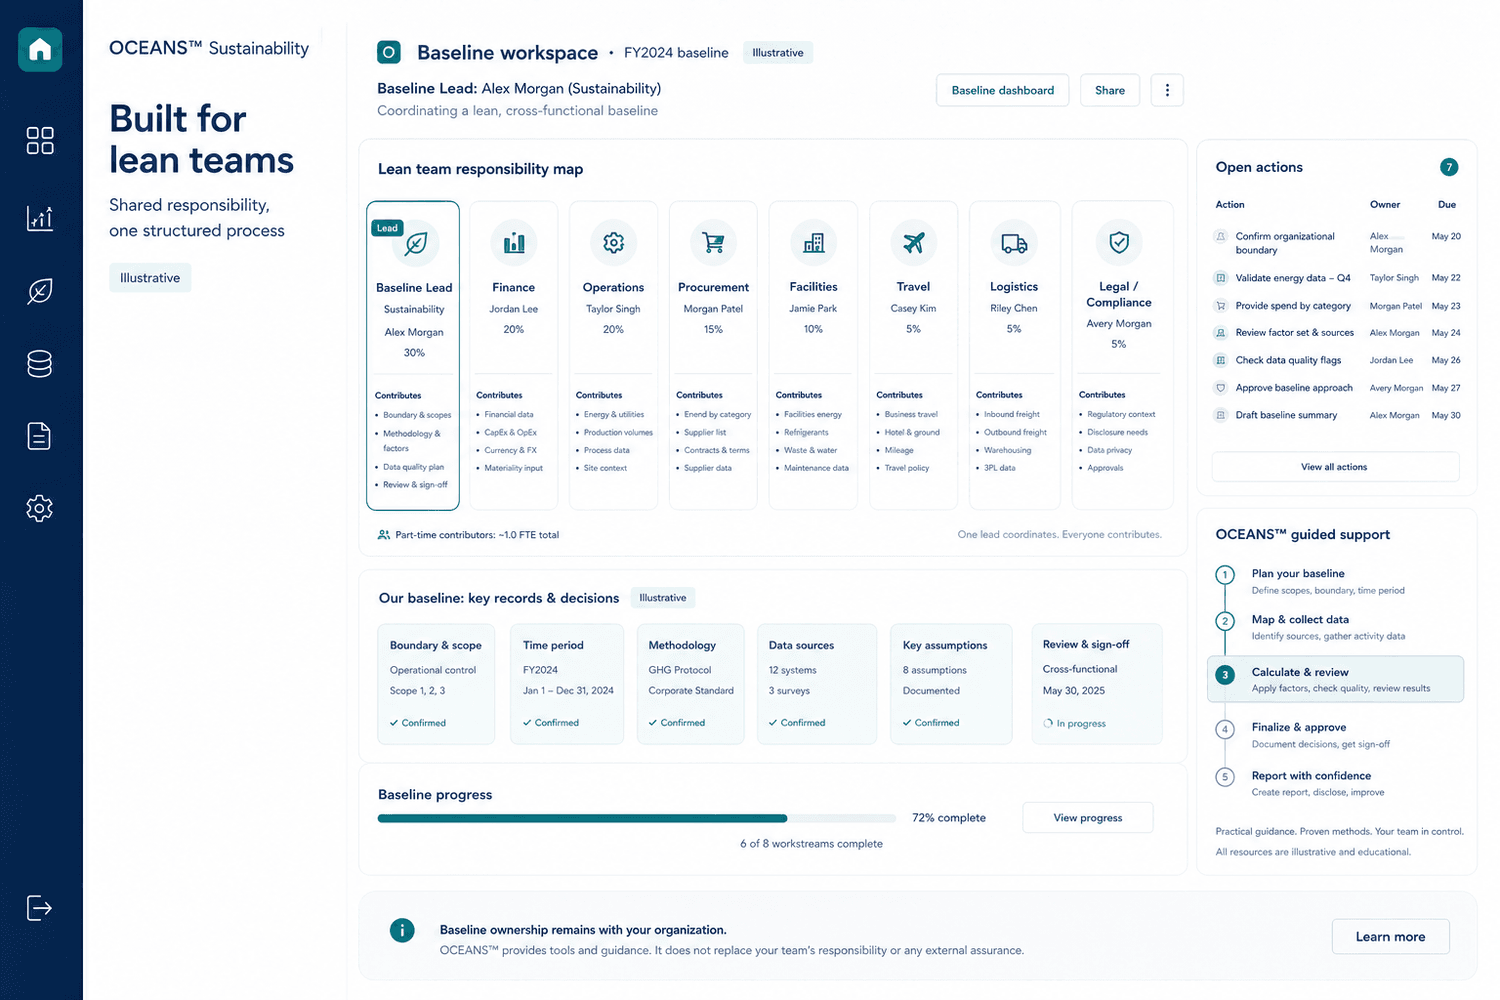
OCEANS™ Sustainability supports coordination across these contributors — ownership of the baseline remains with your organization.
You do not need perfect data to begin
Most organizations start with bills, invoices, ledgers, travel records, waste reports, freight statements, supplier files, and reasonable estimates:
- Bills and invoices
- Ledgers
- Travel records
- Waste reports
- Freight statements
- Supplier files
- Reasonable estimates
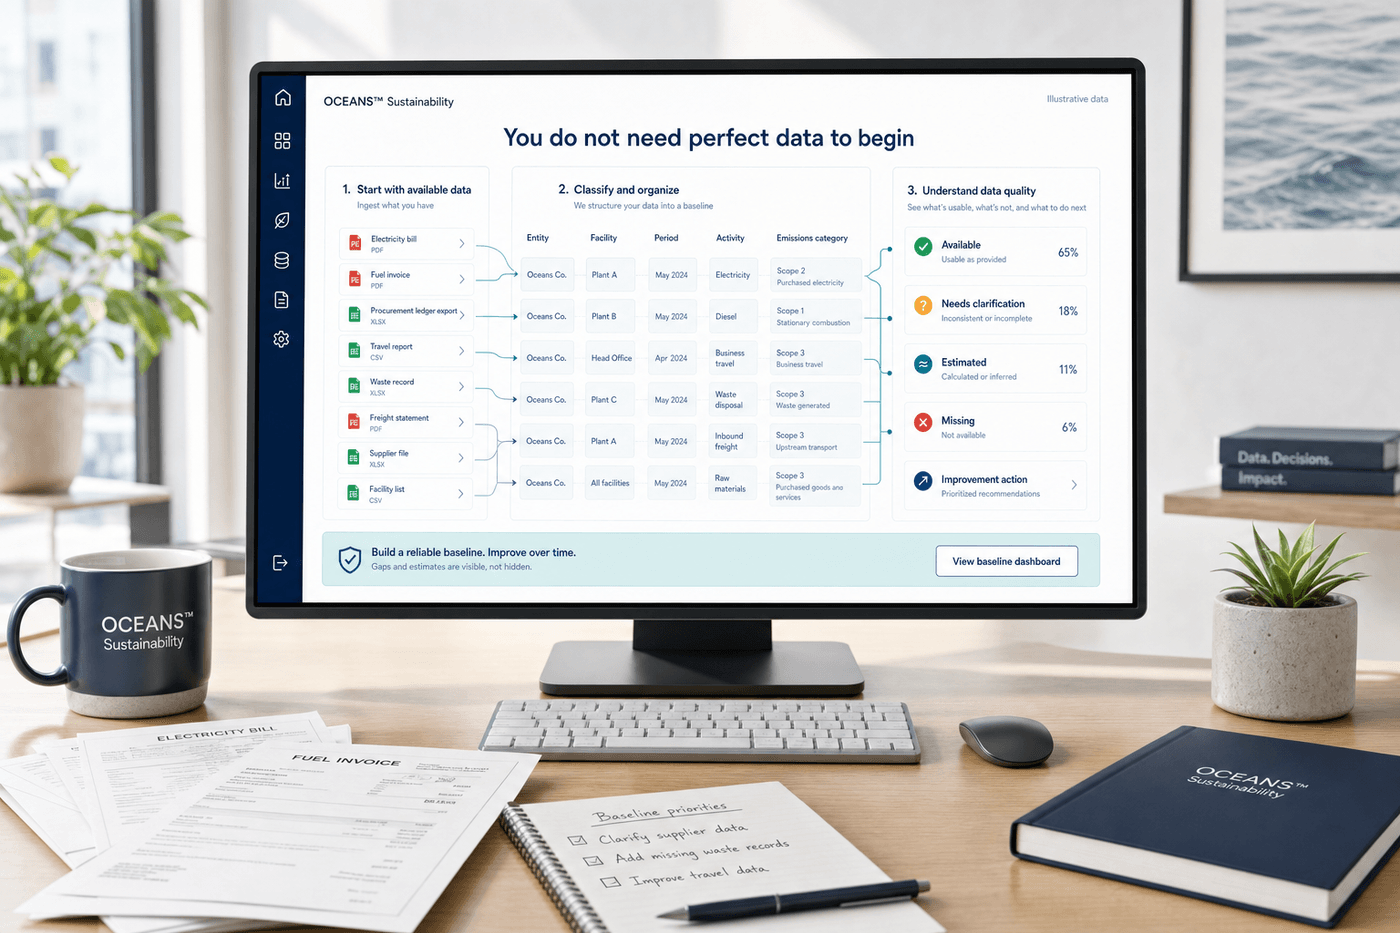
A useful first baseline should be transparent about its limitations—not pretend uncertainty does not exist.
How it works
A guided path to your first emissions inventory
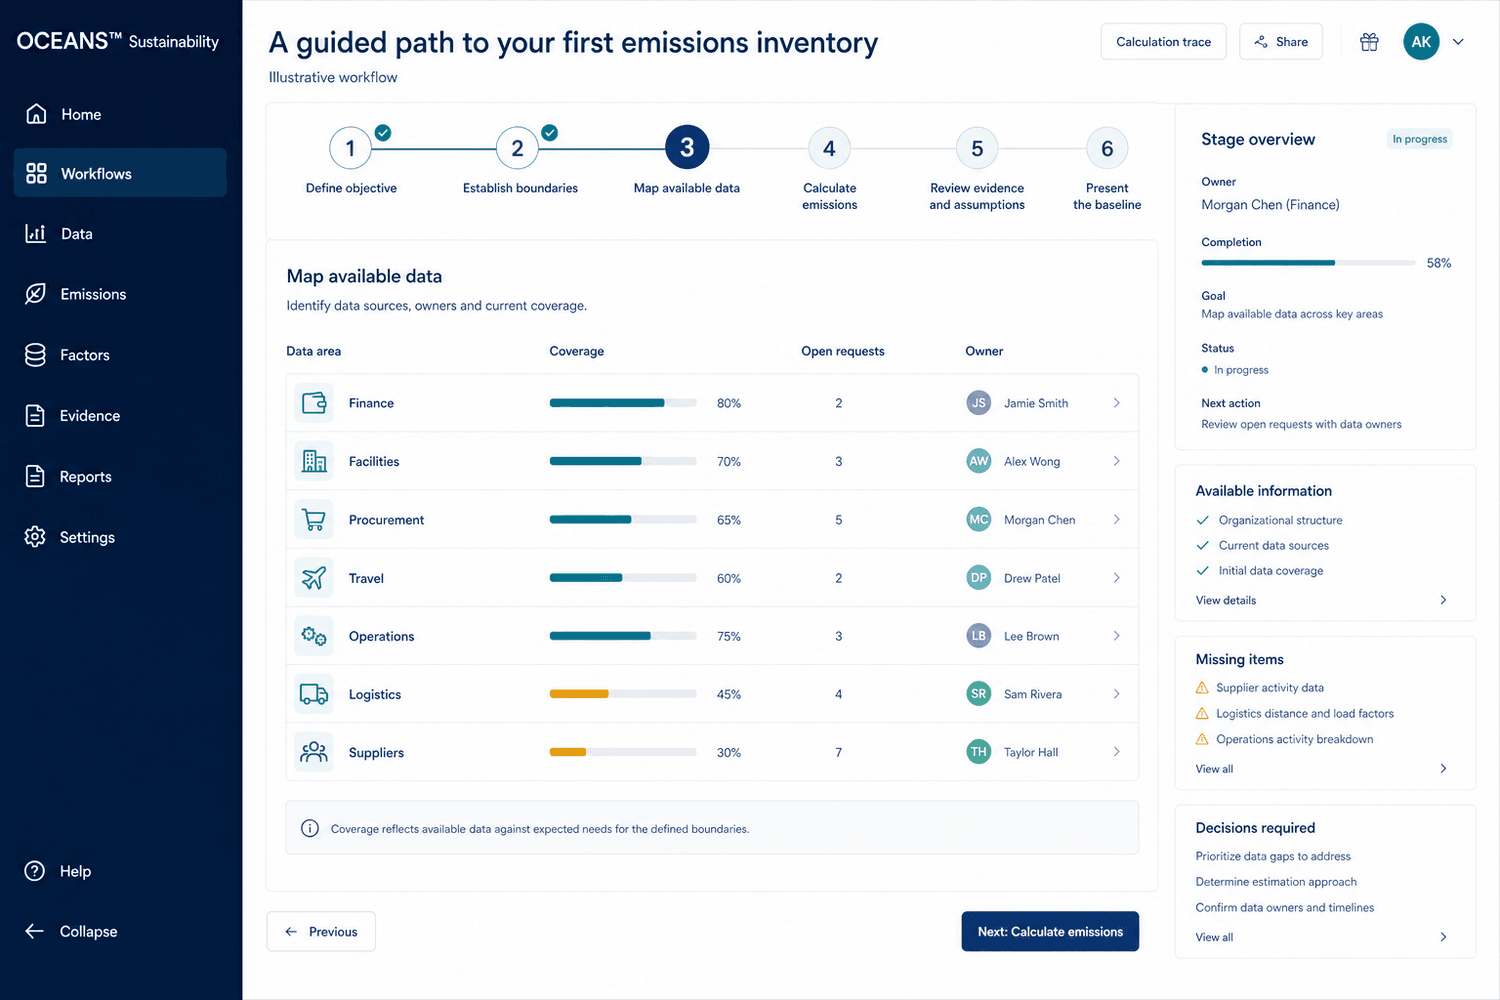
- 01
Define the objective
Purpose, audience, and reporting period.
- 02
Establish boundaries
Entities, facilities, operations, and included sources.
- 03
Map available data
Locate records and owners across the business.
- 04
Calculate emissions
Use documented methods and factors for supported Scope 1, 2, and relevant Scope 3 activities.
- 05
Review evidence and assumptions
Inspect source records, estimates, exclusions, and unresolved gaps.
- 06
Present the baseline
Summarize emissions, categories, methods, limitations, and next steps.
Understand emissions across your operations and value chain
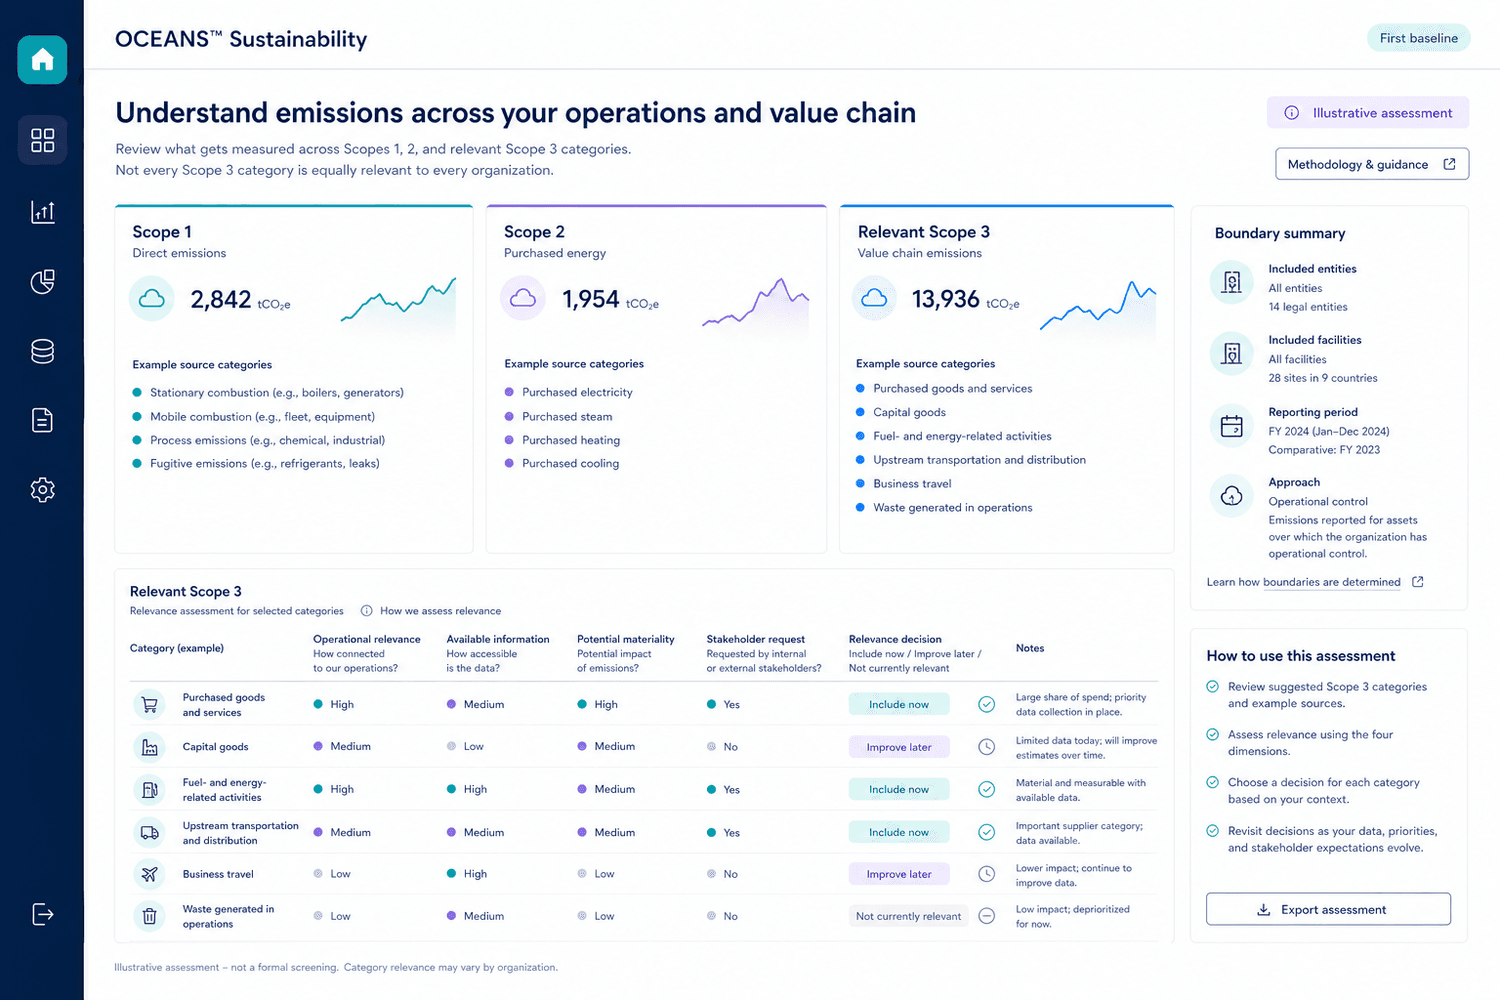
Scope 1
Direct emissions
Emissions from sources owned or controlled by your organization.
- Stationary fuel combustion
- Company-owned vehicles
- Refrigerant leakage
- Process emissions
Scope 2
Purchased energy
Emissions associated with purchased electricity, steam, heating, and cooling.
- Purchased electricity
- Purchased steam
- Purchased heating
- Purchased cooling
Relevant Scope 3
Value-chain emissions
Upstream and downstream categories relevant to your business and available information.
- Purchased goods and services
- Capital goods
- Fuel- and energy-related activities
- Business travel
- Waste generated in operations
Relevant Scope 3 categories are selected based on your operations, available information, potential materiality, and reporting objectives. Not every category is equally relevant to every organization.
Start with what you have
Your existing business records become the foundation
- Utilities
- Fuel
- Refrigerants
- Procurement and general ledger
- Travel
- Employee commuting
- Freight and logistics
- Waste
- Supplier information
- Facility information
- Organizational information
More than a single emissions number
A transparent starting point.
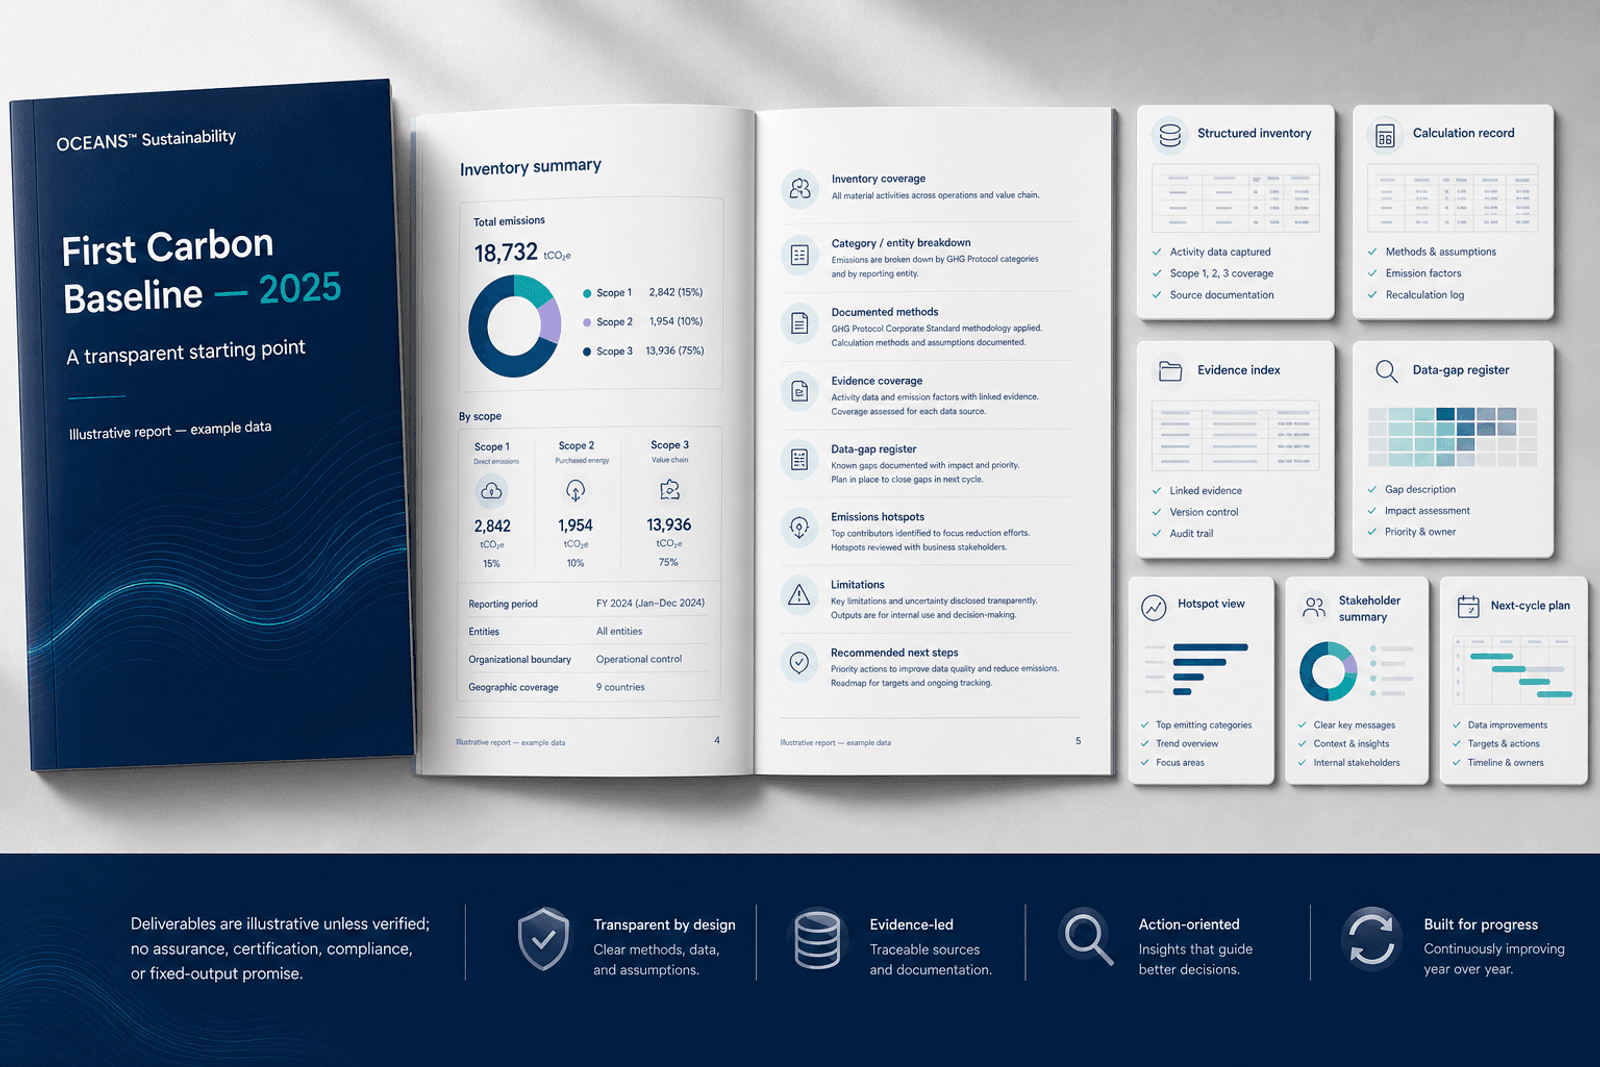
- Structured emissions inventory
- Documented calculation methods
- Connected supporting evidence
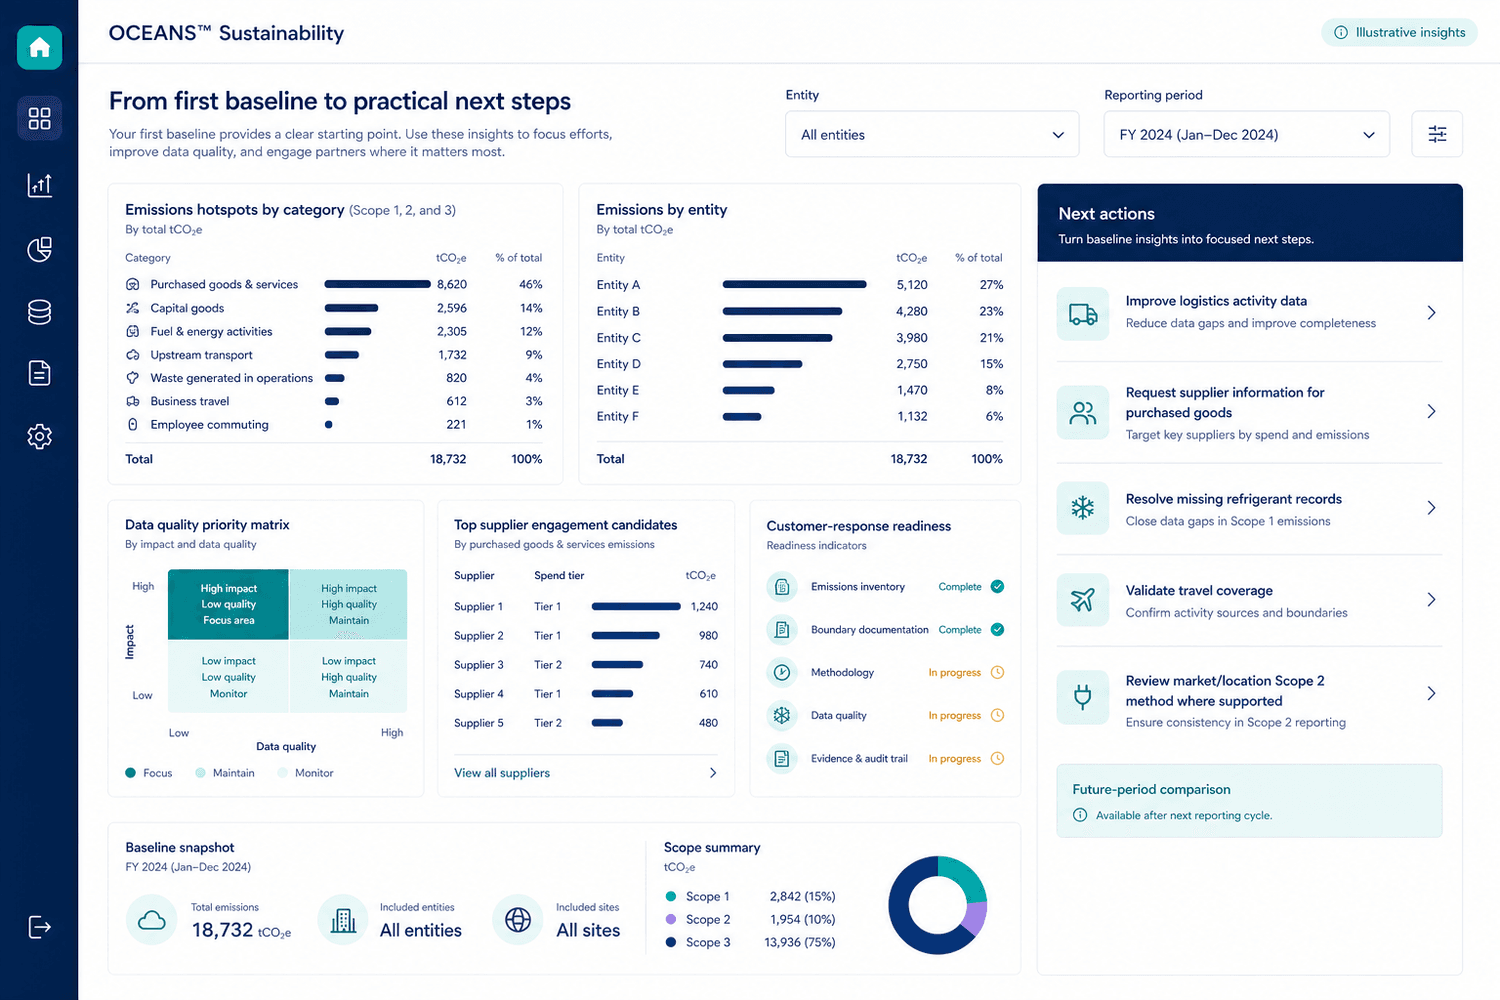
- Data-gap register
- Emissions-hotspot view
- Stakeholder-ready summary
- Repeatable next-cycle process
Understand what is measured, estimated, and still missing
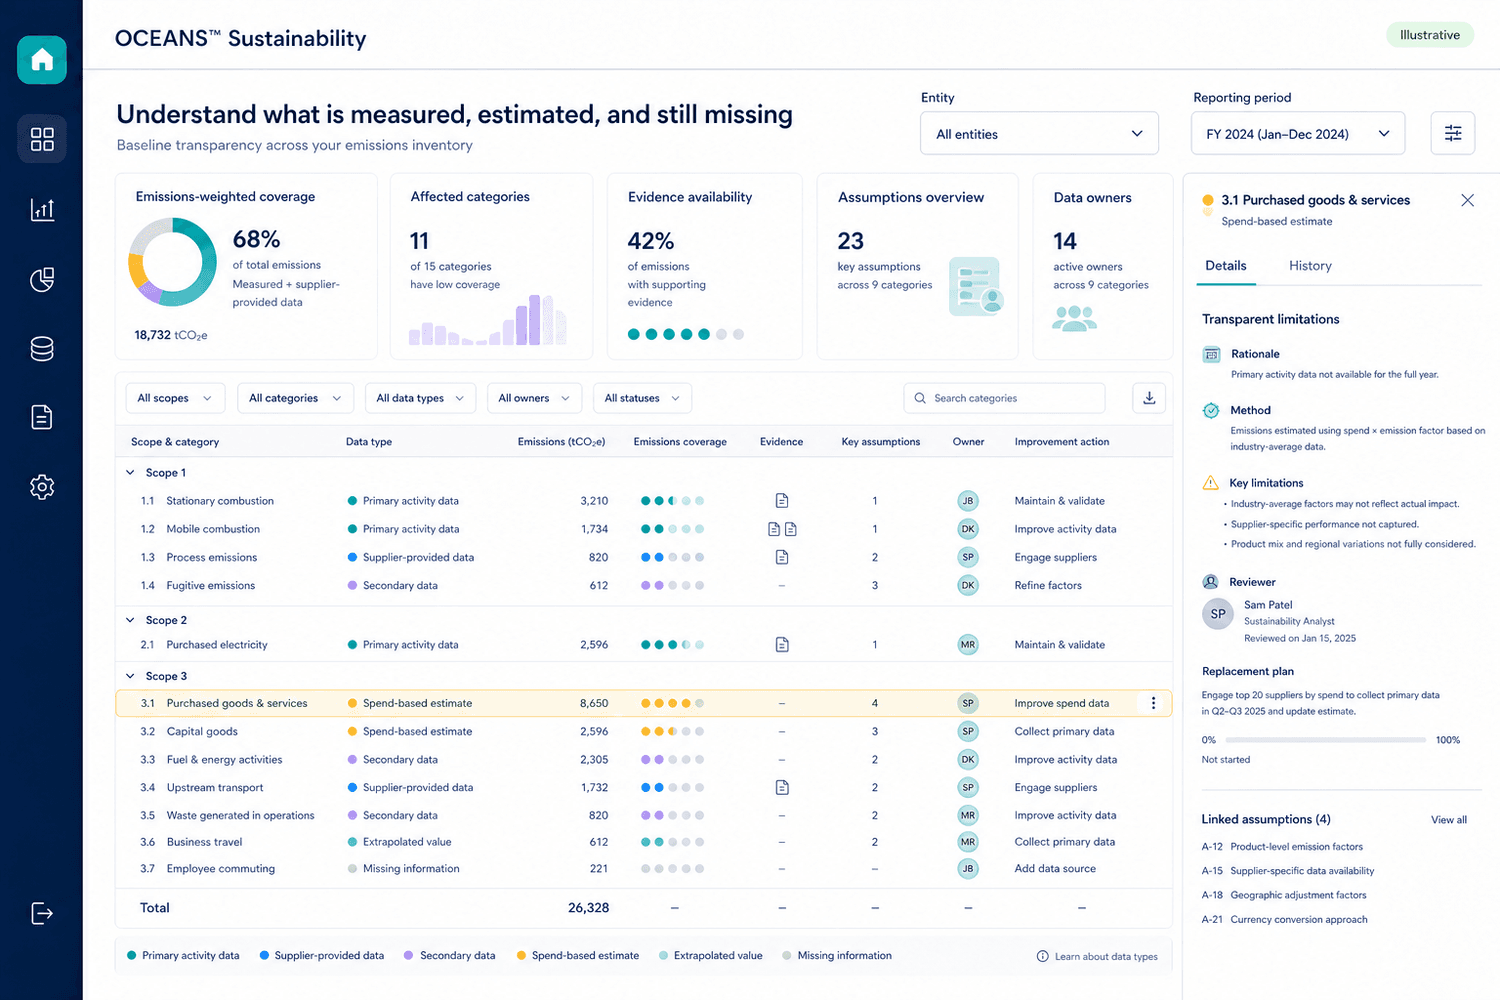
Primary activity data
Measured directly from your own operations.
Supplier-provided data
Given directly by a supplier or partner.
Secondary data
Drawn from an external reference dataset.
Spend-based estimates
Calculated from spend using an average factor.
Extrapolated values
Inferred from a related, available data point.
Missing information
Not yet available, and documented as a gap.
This makes the baseline easier to explain and creates a practical roadmap for improving it.
Turn your first baseline into a business decision tool
Why OCEANS™ Sustainability
A practical alternative to spreadsheets and enterprise complexity
Guided from the beginning
A structured starting point instead of a blank spreadsheet.
Structured for repeatability
Built to be reused for the next reporting period, not just this one.
Transparent by design
Gaps and estimates stay visible instead of hidden.
Built for lean teams
Designed for organizations without a large sustainability department.
Ready to improve
A foundation you can strengthen with every cycle.
Enterprise-grade discipline for companies beginning their carbon-accounting journey.
Choose a baseline process you can continue using
| Approach | Common limitation | With OCEANS™ Sustainability |
|---|---|---|
| Spreadsheets | Difficult to trace and repeat | A structured calculation workflow |
| Consultant-only project | Knowledge may remain outside your team | Software plus guided implementation |
| Basic online calculator | Limited organizational detail or evidence | Connected data, calculations, and records |
| Enterprise platform | May require significant resources and complexity | A focused approach built for lean teams |
What determines the baseline timeline?
Timing depends on your organizational structure, data availability, reporting period, relevant Scope 3 coverage, and internal review — not a fixed schedule.
- Entities and facilities in scope
- Categories to include
- Available and missing data
- Owners across the business
- Calculation approaches
- Priorities
- Delivery plan
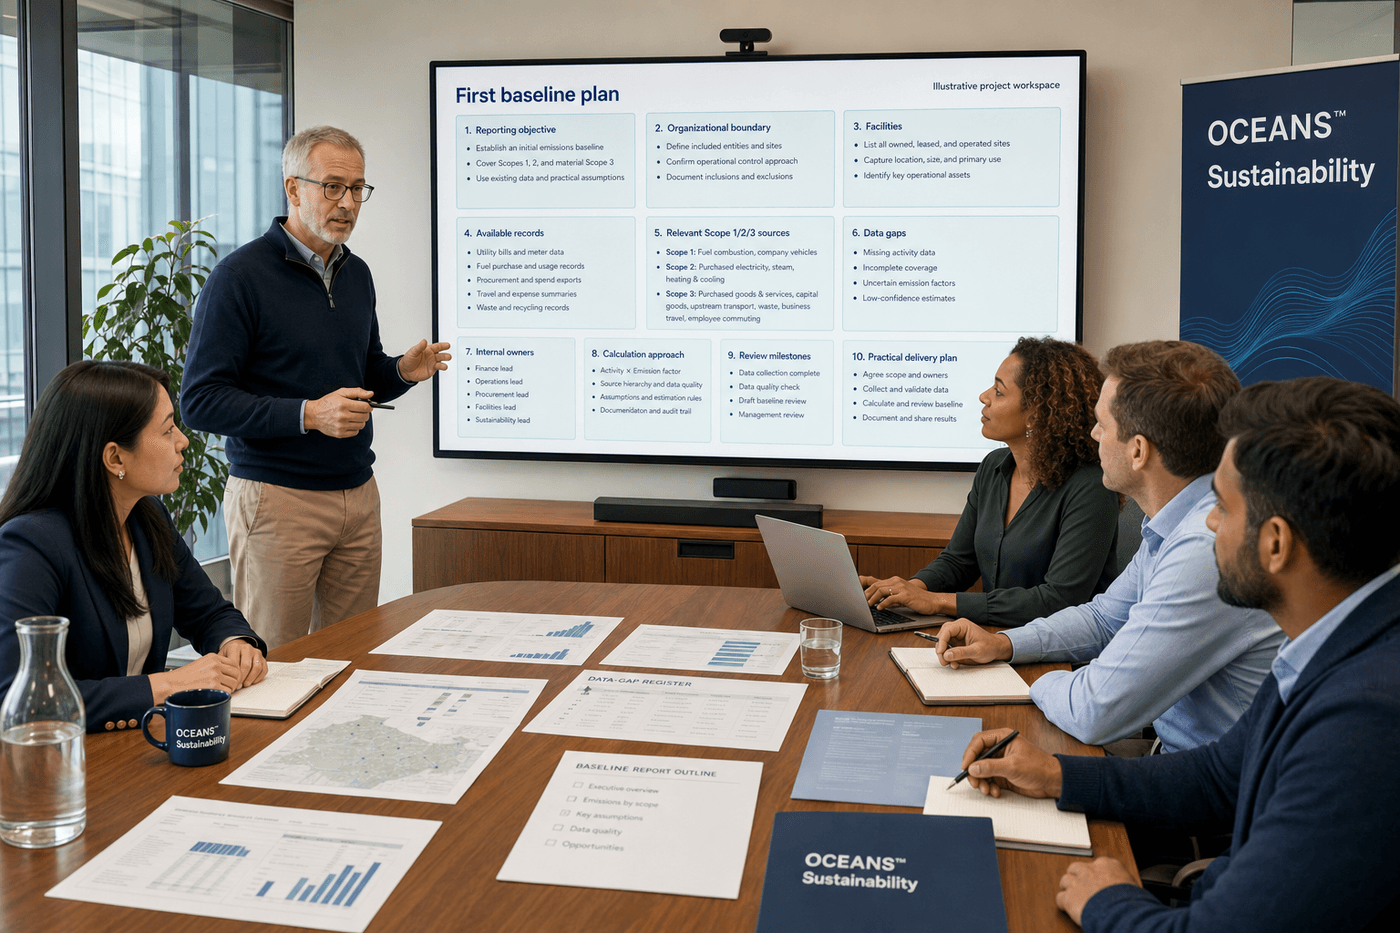
A practical first-baseline plan, built with your team
OCEANS™ Sustainability works with your contributors to define objectives and boundaries, map available records, identify relevant sources, document gaps, agree on methods, assign owners, plan review, and establish a practical delivery approach covering:
- Objectives and boundaries
- Available records
- Relevant sources
- Data gaps
- Methods and owners
- Review plan
Frequently asked questions
Where to go next
Current availability
OCEANS™ Sustainability is in active product development. Access is currently limited to founding design partners — the workflow, screens, and outcomes described on this page are the design in progress, and any product screens shown are an illustrative preview of planned functionality. Guides, checklists, and the calculator elsewhere on this site are real and available now. Apply as a founding design partner to help test and shape this workflow as it is built.
Take the first step toward a credible carbon baseline
Tell us what prompted your carbon-accounting journey. We will help you understand the information required, the likely data gaps, and a practical path forward.