OCEANS™ SUSTAINABILITY · CONNECT DATA
Bring sustainability data into one structured workspace
Collect utility, fuel, procurement, travel, logistics, waste and supplier data in a consistent sustainability workspace with clear ownership, reporting periods, source records and visible gaps.
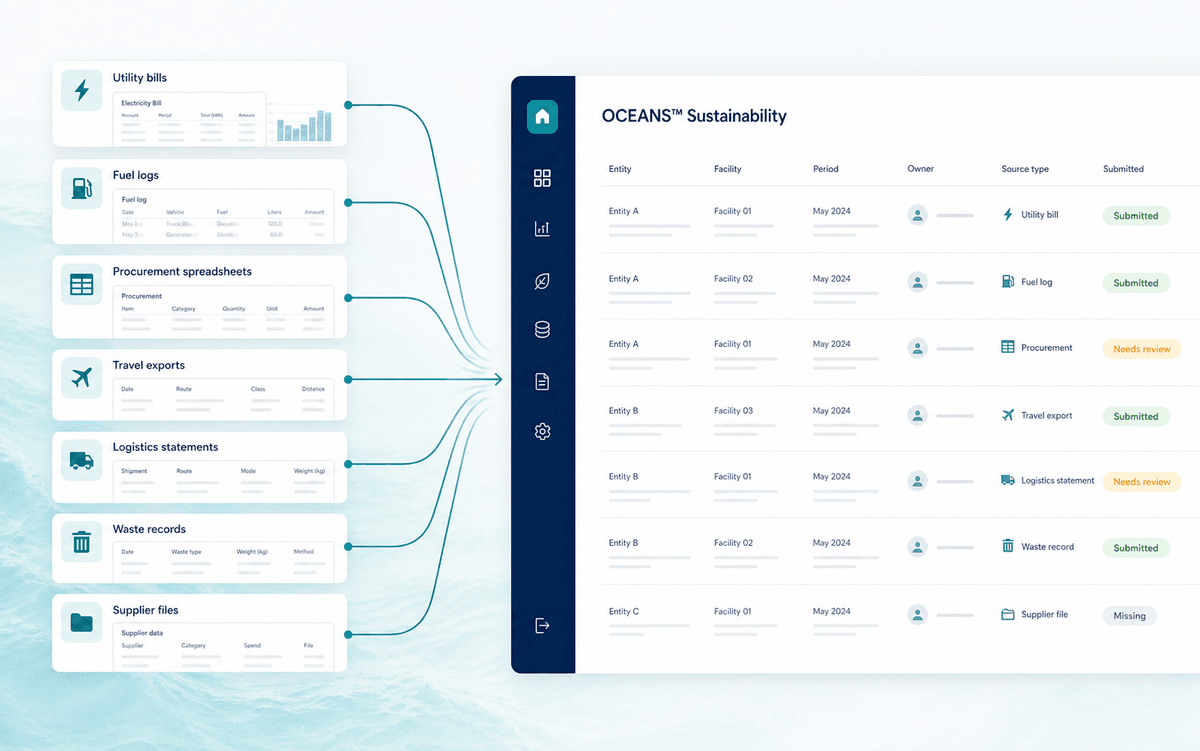
Data coverage
Start with the information your organization already has
Most of the data a carbon inventory needs already exists somewhere — it's just spread across different teams, systems, and file formats. OCEANS™ Sustainability is organized around the business-data domains that actually produce emissions, so nothing has to be recreated from scratch.
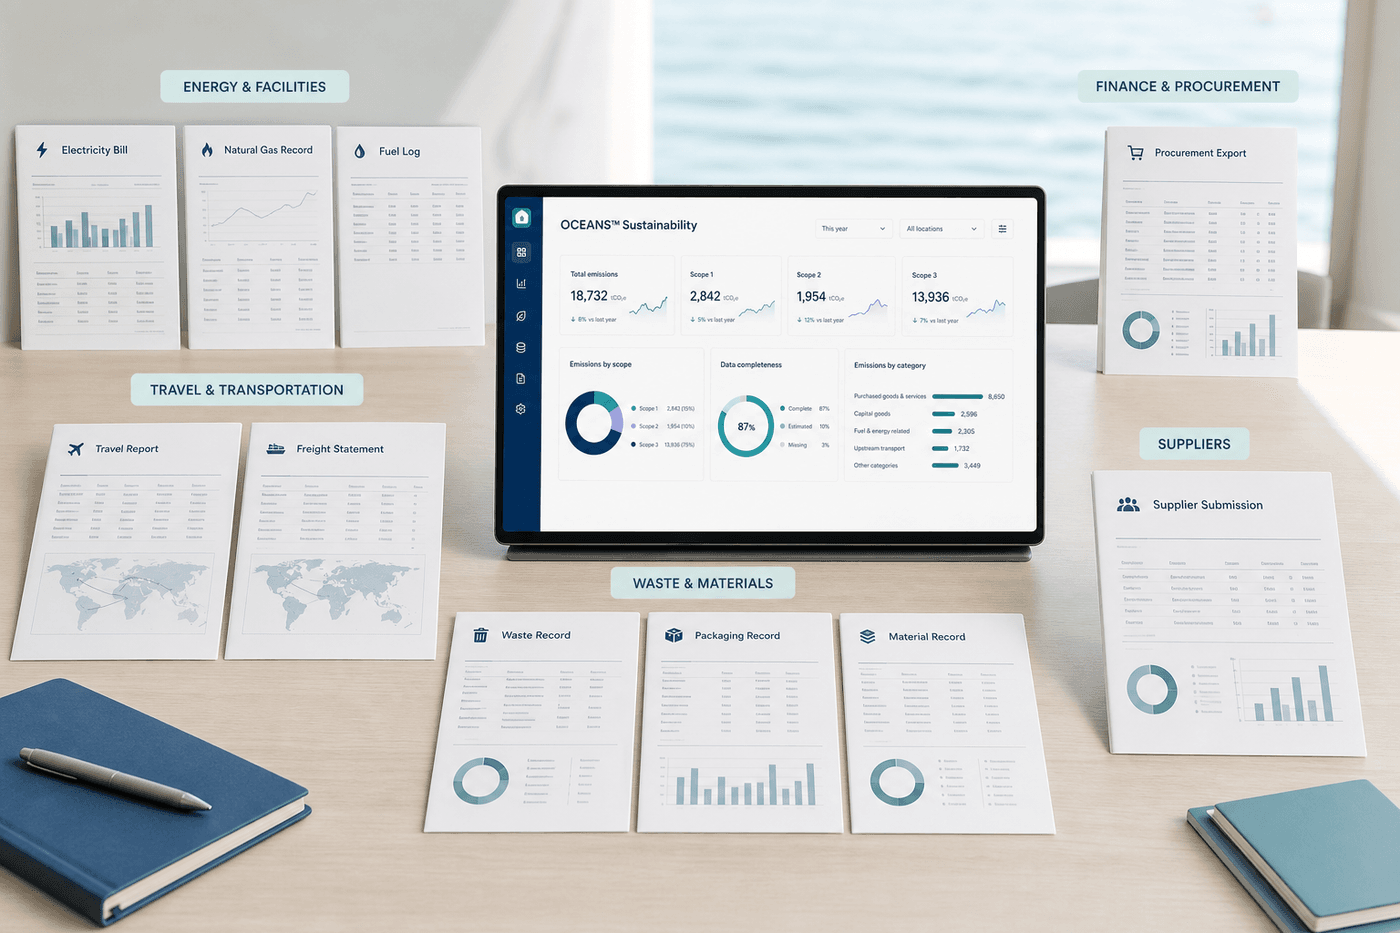
Energy & Facilities
Electricity bills, natural gas records, fuel logs
Finance & Procurement
Procurement exports, purchased goods and services
Travel & Transportation
Travel reports, freight and logistics statements
Waste & Materials
Waste records, packaging and material records
Supplier information
Supplier submissions and Scope 3 data requests
Collection workflow
A clear process for every reporting cycle
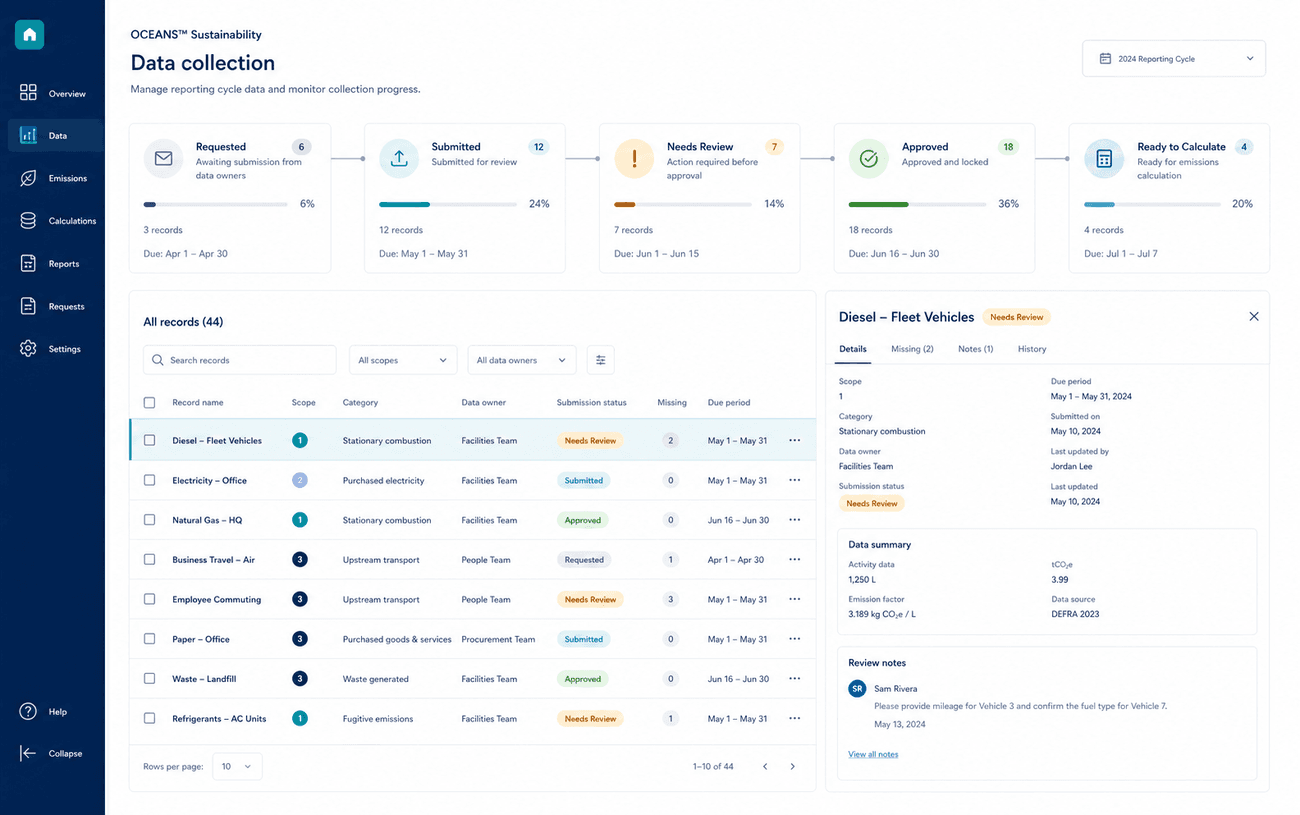
Every record moves through the same visible stages, so a reporting cycle's progress is a status you can check, not a question you have to ask around.
- Requested
- Submitted
- Needs Review
- Approved
- Ready to Calculate
Cross-functional collaboration
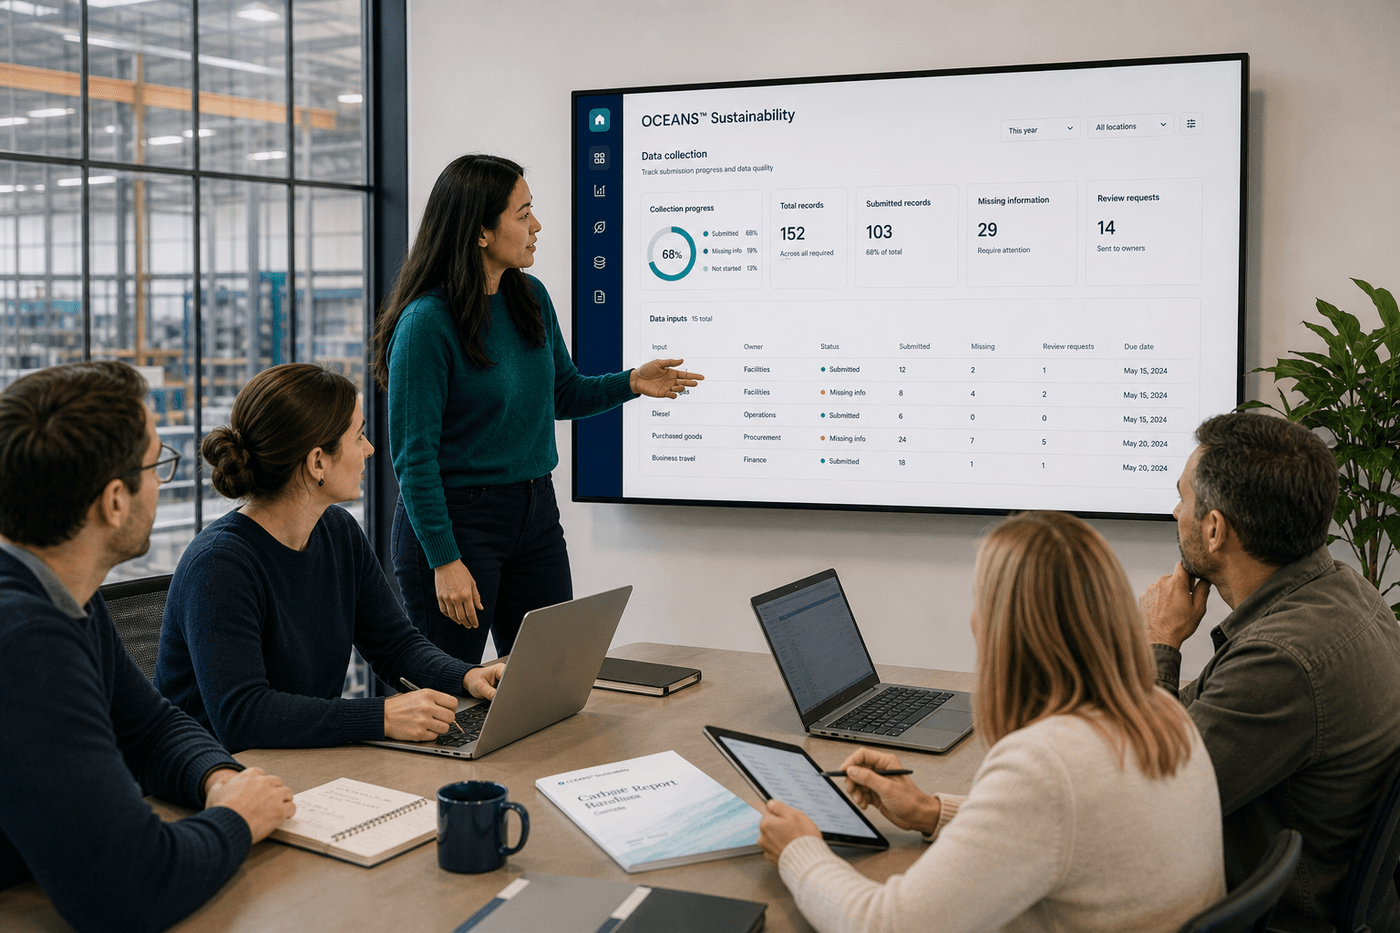
Make data collection a shared process
Facilities, finance, operations, and procurement teams each hold a piece of the inventory. OCEANS™ Sustainability shows who owns which record, what's still missing, and where a review request is waiting — so collecting a reporting period's data is a coordinated effort instead of a chain of one-off emails.
Data organization
Create consistency before calculation
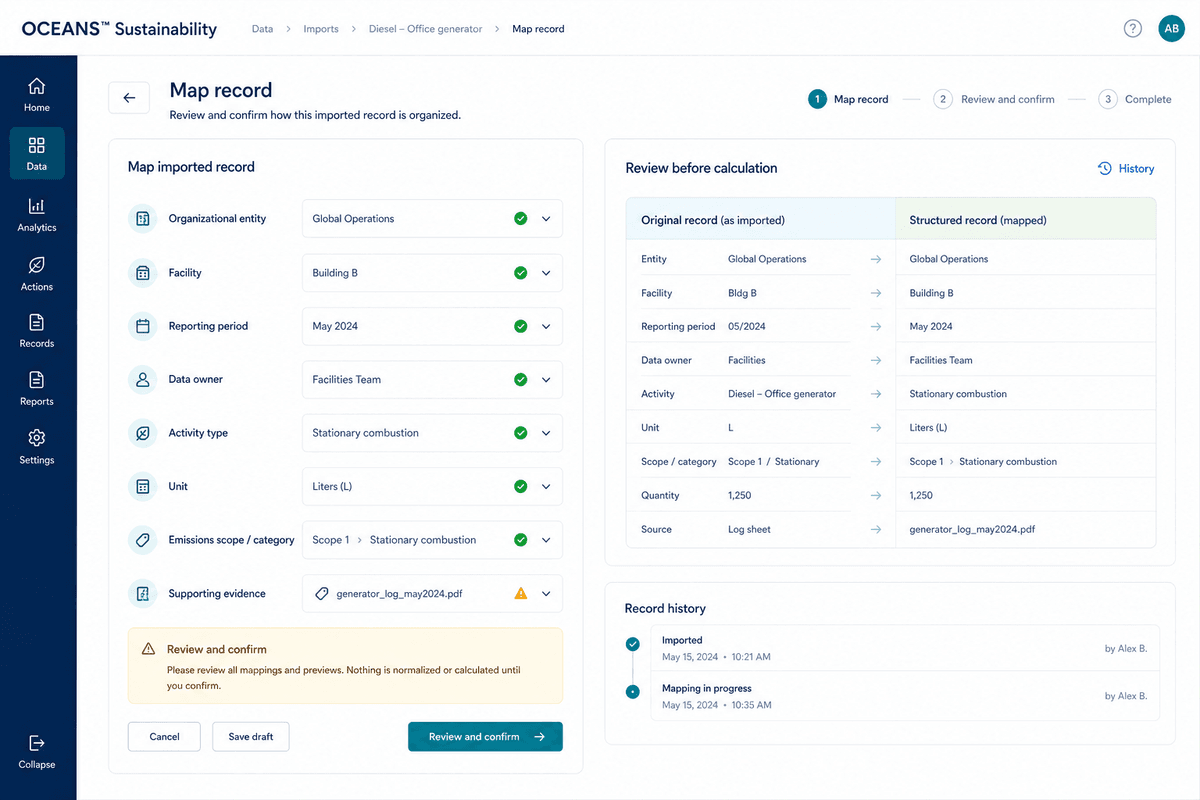
An imported record is mapped to its entity, facility, reporting period, owner, activity type, unit, and emissions category — then presented for review and confirmation before it moves forward. Nothing is normalized or calculated silently; a person reviews and confirms every mapping.
Data quality
Find gaps before they become reporting problems
A quality issue is either caught automatically or flagged by a reviewer — and the platform keeps that distinction visible instead of blending everything into one queue.
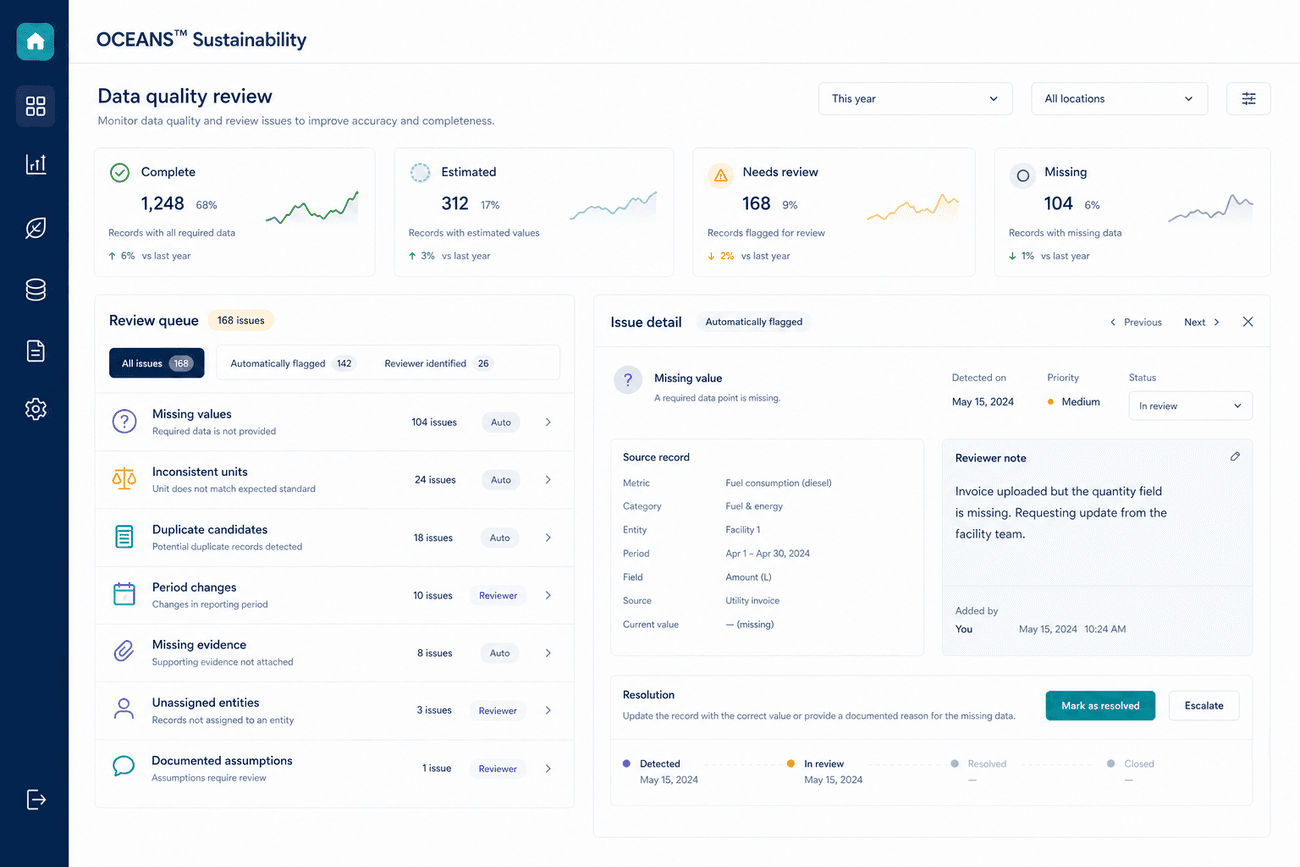
Automatically flagged
Missing values
A required data point was not provided.
Inconsistent units
A unit doesn't match the expected standard for that record type.
Duplicate candidates
Two or more records appear to describe the same activity.
Reviewer identified
Period changes
A reporting period was edited after initial submission.
Unassigned entities
A record has not yet been linked to an entity or facility.
Documented assumptions
An assumption was recorded and needs a second look.
Evidence continuity
Keep every record connected to its source
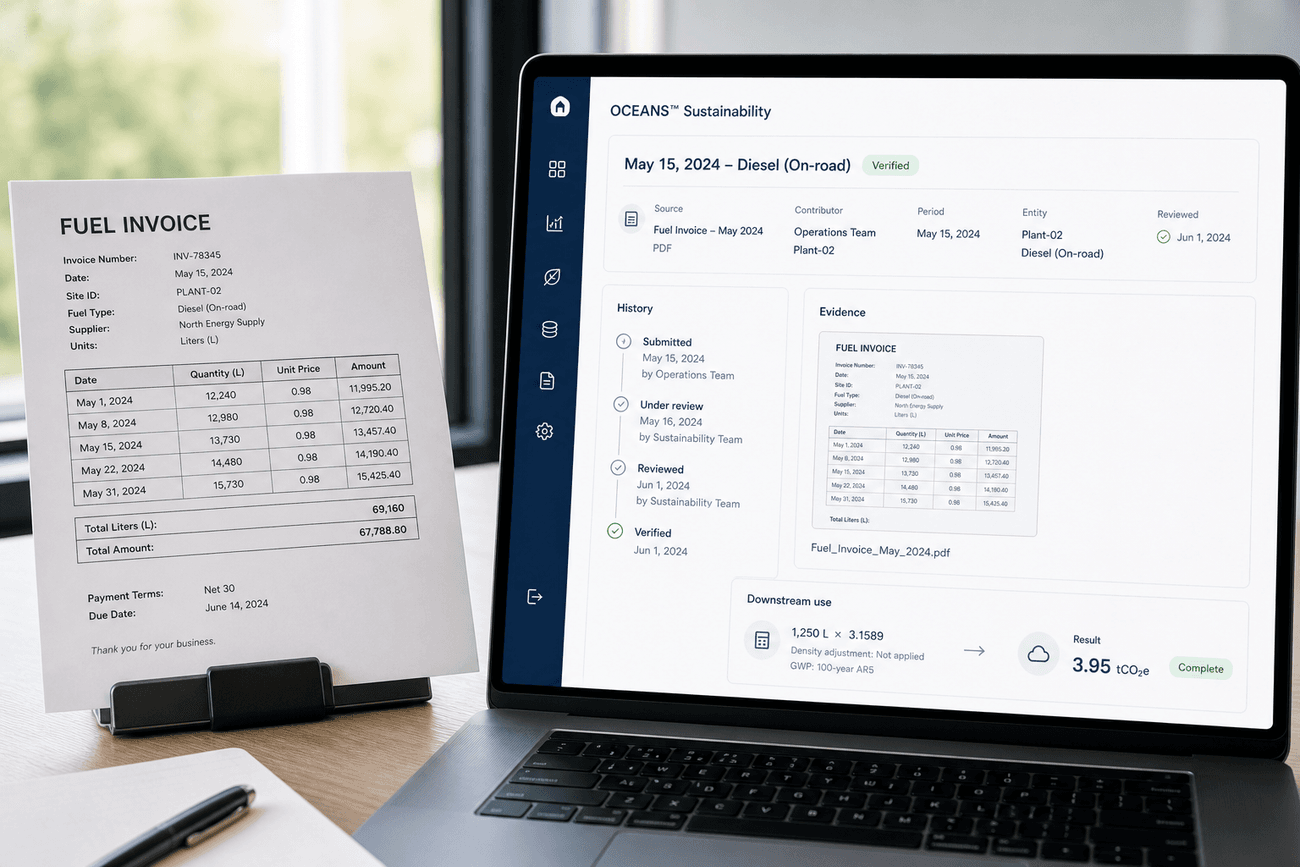
A record brought in during collection carries its context with it — where it came from and who's accountable for what happens next.
- Source record
- Contributor
- Reporting period
- Entity
- Review history
- Evidence
- Downstream use

Guided implementation
Start with the data you have—not the data you wish you had
A first carbon baseline doesn't require perfect data. OCEANS™ Sustainability's implementation team works from what's actually available, closing gaps over time rather than stalling until every record is complete.
- 01
Understand the organization and objectives
Clarify reporting needs, boundaries, and who is involved.
- 02
Map available data and identify gaps
Review existing records and flag what is missing or unclear.
- 03
Configure relevant entities and emissions categories
Set up the structure your inventory will be organized around.
- 04
Import and review initial records
Bring in available data and check it for completeness.
- 05
Calculate and validate the baseline
Produce the first Scope 1, 2, and 3 results and review them together.
- 06
Prepare outputs for stakeholders
Turn the validated baseline into reporting-ready information.
Frequently asked questions
What kinds of business data can OCEANS™ Sustainability connect?
Energy and facilities records (electricity bills, natural gas, fuel logs), finance and procurement exports, travel and transportation records, waste and materials records, and supplier submissions — the business-data domains that actually produce emissions.
Does OCEANS™ normalize or calculate data automatically?
No. An imported record is mapped to its entity, facility, reporting period, owner, activity type, unit, and emissions category, then presented for review — nothing is normalized or calculated silently, and a person confirms every mapping.
How does OCEANS™ handle data-quality issues during collection?
Some issues are flagged automatically (missing values, inconsistent units, duplicate candidates); others are identified by a reviewer (period changes, unassigned entities, documented assumptions). The two categories stay visibly separate rather than blending into one queue.
Do I need complete data before starting?
No. A first carbon baseline doesn't require perfect data — the implementation team works from what's actually available and closes gaps over time rather than stalling until every record is complete.
Current availability
OCEANS™ Sustainability is in active product development. Access is currently limited to founding design partners — the workflow, screens, and outcomes described on this page are the design in progress, and any product screens shown are an illustrative preview of planned functionality. Guides, checklists, and the calculator elsewhere on this site are real and available now. Apply as a founding design partner to help test and shape this workflow as it is built.
Start with the data you already have
See how OCEANS™ Sustainability organizes your records before you calculate a single emissions figure.