OCEANS™ CALCULATE EMISSIONS
Calculate Scope 1, 2 and 3 emissions with methods you can explain
Convert operational activity into source-linked greenhouse-gas calculations for corporate inventories, California SB 253 reporting and the emissions analysis that supports climate-risk decisions. Keep boundaries, factors, assumptions, reporting periods and review status visible.
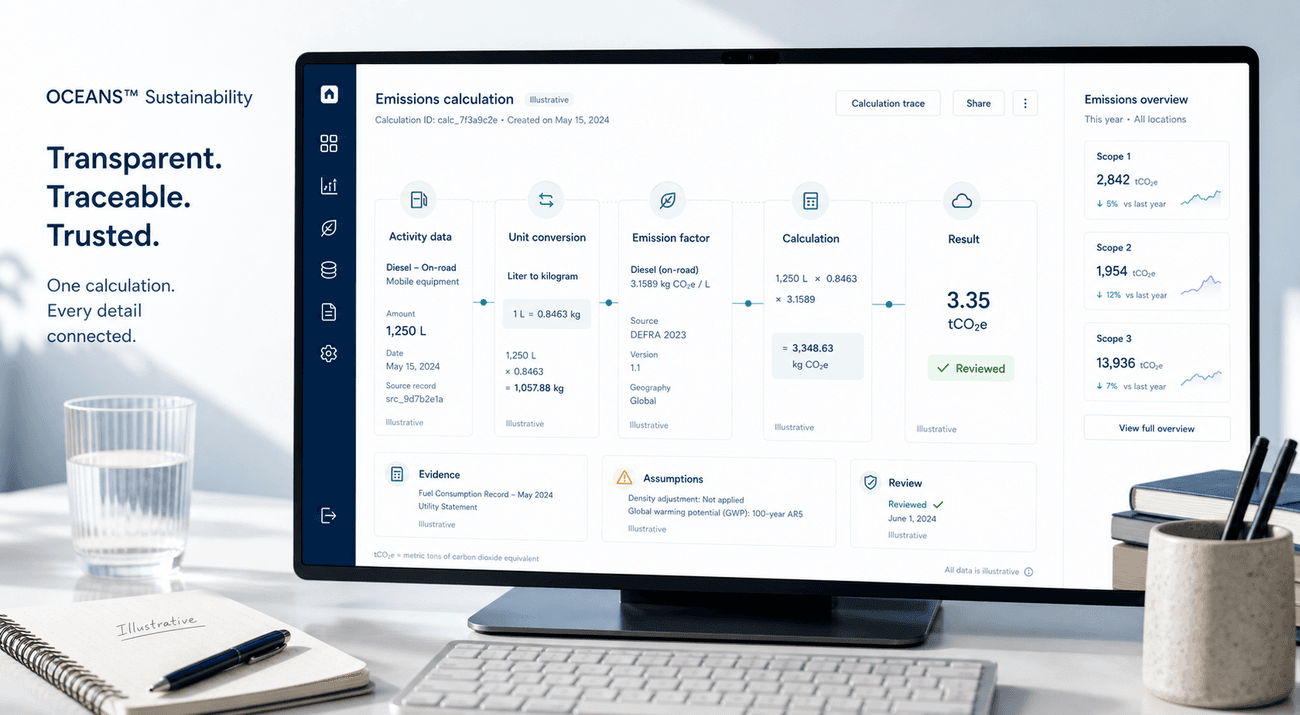
Understand not only your emissions total—but how it was calculated.
- Activity data
- Unit conversion
- Emission factor
- Formula
- Result
- Evidence
- Assumptions
- Review
A carbon total is only useful when you can explain it
Carbon accounting involves more than applying a factor to a spreadsheet value. Teams must determine boundaries, categorize activities, select appropriate emission factors, manage estimates, and preserve a consistent calculation history. When this work is spread across spreadsheets, calculations become difficult to review, repeat, and communicate. OCEANS™ Sustainability is designed to bring the process into one structured and transparent workflow.
Hidden calculation logic
Stakeholders cannot easily understand how a reported value was actually produced.
Inconsistent emission factors
Different teams may use different sources, versions, units, and assumptions.
Difficult Scope 3 calculations
Value-chain data is often incomplete, estimated, or distributed across suppliers.
Limited repeatability
Spreadsheet calculations are difficult to reproduce consistently in the next reporting period.
CALIFORNIA CLIMATE REPORTING
How does OCEANS™ support SB 253 and SB 261 readiness?
OCEANS™ Sustainability gives U.S. manufacturers a controlled emissions-data foundation for California SB 253 and SB 261 reporting. For SB 253, it connects Scope 1, Scope 2 and Scope 3 calculations to source records, factor versions, assumptions and review history. For SB 261, it provides documented emissions trends, operational hotspots and data limitations that can inform management's climate-related financial-risk analysis.
The two laws ask different questions. SB 253 asks what the company emitted and how the figures were produced. SB 261 asks how climate-related risks could affect the business and how those risks are governed. A defensible process needs both reliable quantitative information and accountable business judgment.
OCEANS™ Sustainability is AI-assisted carbon-accounting software built for growing U.S. manufacturers. It connects operational and supplier data with Scope 1, Scope 2 and Scope 3 calculations, emissions factors, assumptions, source evidence and human review.
SB 253
Build the emissions evidence chain
Core question: What did the company emit across Scope 1, Scope 2 and Scope 3, and can the reported figures be traced and reviewed?
- Define entities, facilities, reporting periods and operational boundaries
- Organize Scope 1, Scope 2 and Scope 3 activity data
- Preserve location-based and market-based Scope 2 methods where applicable
- Document emissions-factor source, geography, year, unit and version
- Keep unit conversions, methods, assumptions and estimates visible
- Distinguish measured, supplier-specific, activity-based and spend-based inputs
- Retain review status, comments and calculation history
- Prepare source-linked workpapers and evidence for internal review or independent assurance
OCEANS™ supports calculation control and assurance preparation. Independent assurance is performed by an eligible external assurance provider.
SB 261
Strengthen the quantitative foundation for climate-risk decisions
Core question: Which climate-related risks could affect the business, how are they governed, and what financial consequences could follow?
- Identify emissions concentration by facility, process, energy source, supplier and category
- Compare emissions and activity trends across reporting periods
- Surface dependence on fuels, electricity, logistics and carbon-intensive suppliers
- Make estimates, exclusions and data limitations visible to decision-makers
- Preserve the quantitative assumptions used in scenario and risk discussions
- Connect potential reduction actions with the operational sources they address
- Provide consistent emissions information for finance, risk, operations and leadership review
Management, finance, legal advisers and the board remain responsible for materiality, scenario selection, financial judgments, governance and the final climate-risk disclosure.
One controlled carbon-data foundation, two different reporting needs
- Operational and supplier records
- Controlled Scope 1, 2 and 3 calculations
- Source evidence, factor versions and review history
SB 253 emissions reporting
and assurance preparation
SB 261 climate-risk analysis
and governance discussion
OCEANS™ keeps the underlying emissions information reusable. When a customer questionnaire, CARB reporting requirement, assurance request or management risk review asks for the same figure, the team does not have to rebuild its evidence trail from disconnected spreadsheets.
Scope 1, 2 and 3
Build a complete view of emissions across your business
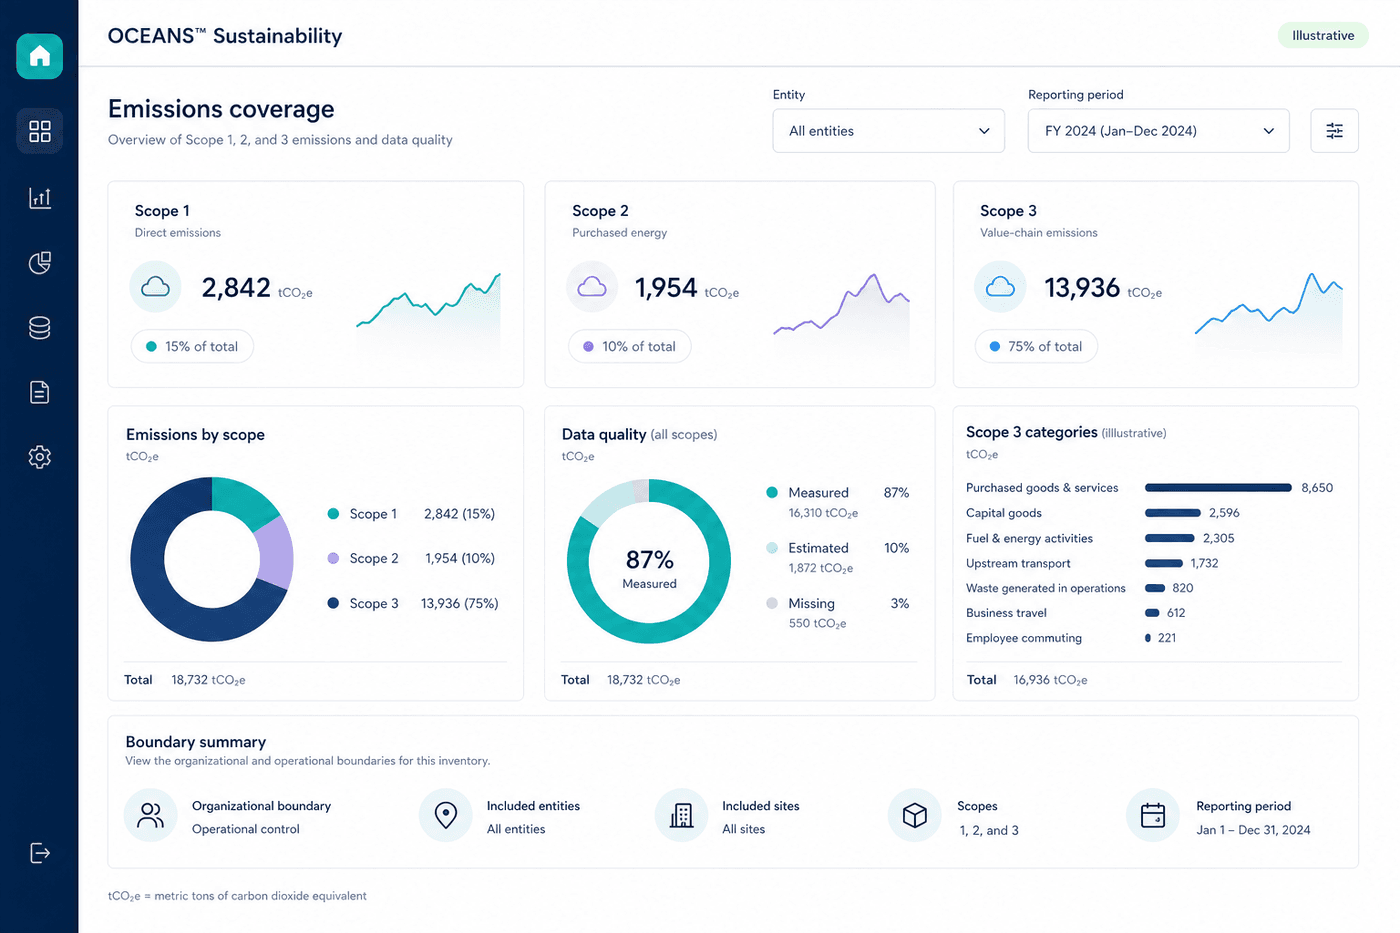
Scope 1
Direct emissions
Emissions from sources owned or controlled by your organization.
- Stationary fuel combustion
- Company-owned vehicles
- Refrigerant leakage
- Process emissions
Scope 2
Purchased energy
Emissions associated with purchased electricity, steam, heating, and cooling.
- Purchased electricity
- Purchased steam
- Purchased heating
- Purchased cooling
Scope 3
Value-chain emissions
Relevant emissions occurring across your upstream and downstream value chain.
- Purchased goods and services
- Capital goods
- Fuel- and energy-related activities
- Transportation and distribution
- Waste generated in operations
- Business travel
- Employee commuting
How it works
A structured process from source data to reported result
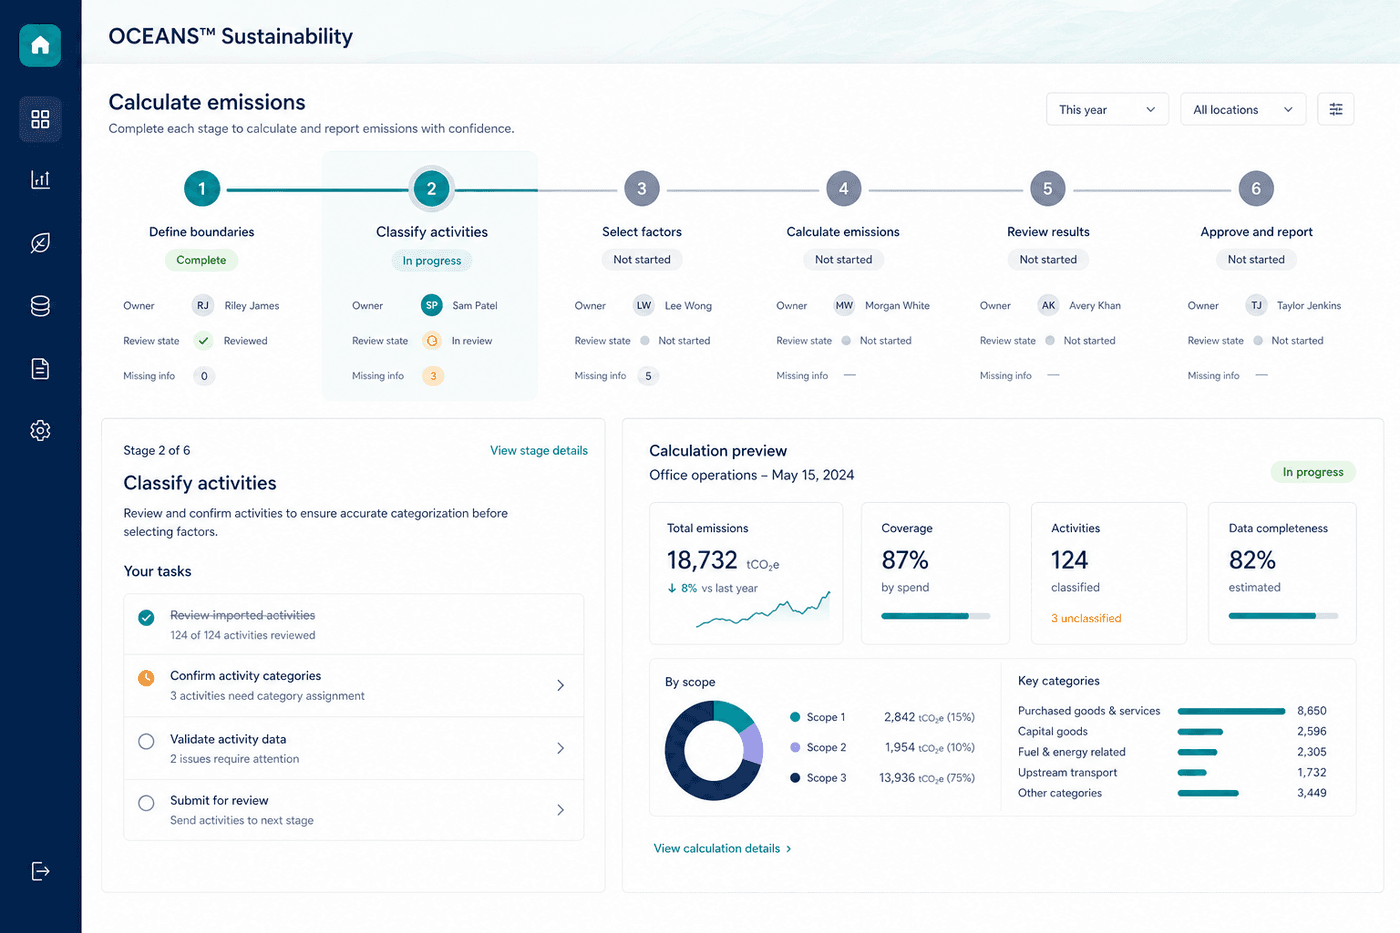
- 01
Define boundaries
Configure the entities, facilities, reporting periods, and emissions sources included in your inventory.
- 02
Classify activities
Associate operational records with the relevant emissions scope, category, and calculation method.
- 03
Select emission factors
Apply documented emission factors based on activity type, geography, reporting period, and available data.
- 04
Calculate emissions
Convert energy, fuel, distance, spend, mass, and other activity information into greenhouse-gas emissions.
- 05
Review results
Identify unusual values, missing information, estimates, and calculations that need additional evidence.
- 06
Approve and report
Finalize reviewed results for dashboards, internal analysis, and stakeholder reporting.
See what is behind every number
OCEANS™ Sustainability is designed to keep each emissions result connected to the information used to produce it. For every calculation, your team can retain:
- Original activity data
- Source document
- Reporting period
- Organizational entity
- Emissions scope and category
- Applied emission factor
- Unit conversions
- Calculation method
- Estimates and assumptions
- Review status
- Calculation history
When a result changes, your team can understand what changed and why.
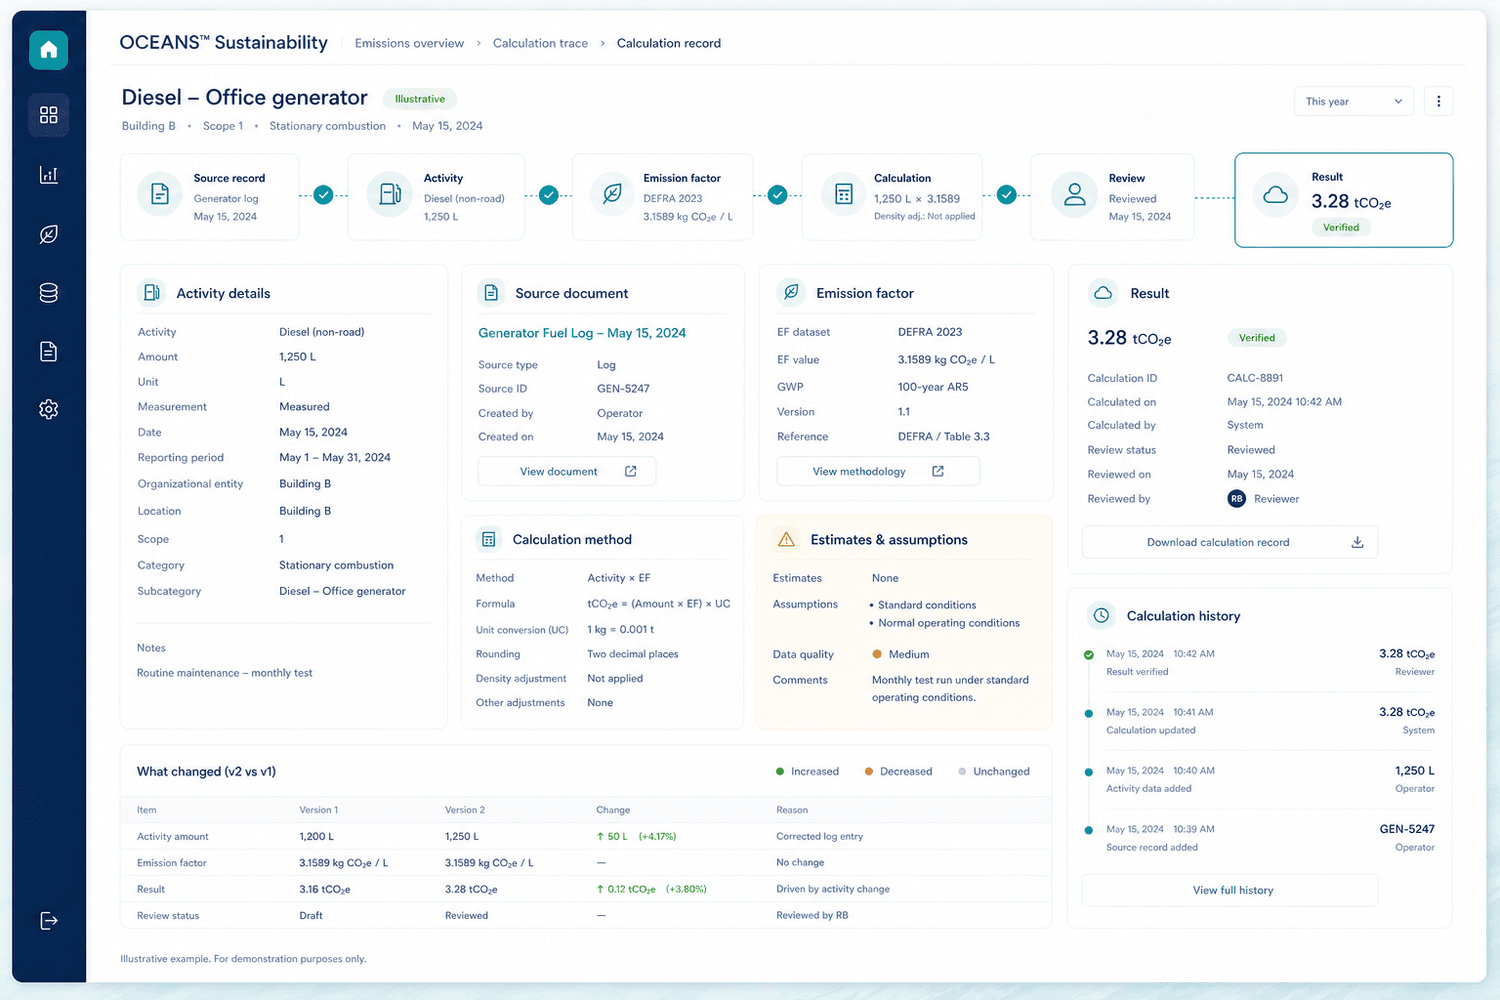
Trace the source
Follow a result back to the record and document it came from.
Review the method
See the formula, unit conversion, and factor applied to produce it.
Understand the change
Compare versions to see what changed between reporting periods, and why.
Emission-factor management
Use documented factors—not unexplained numbers
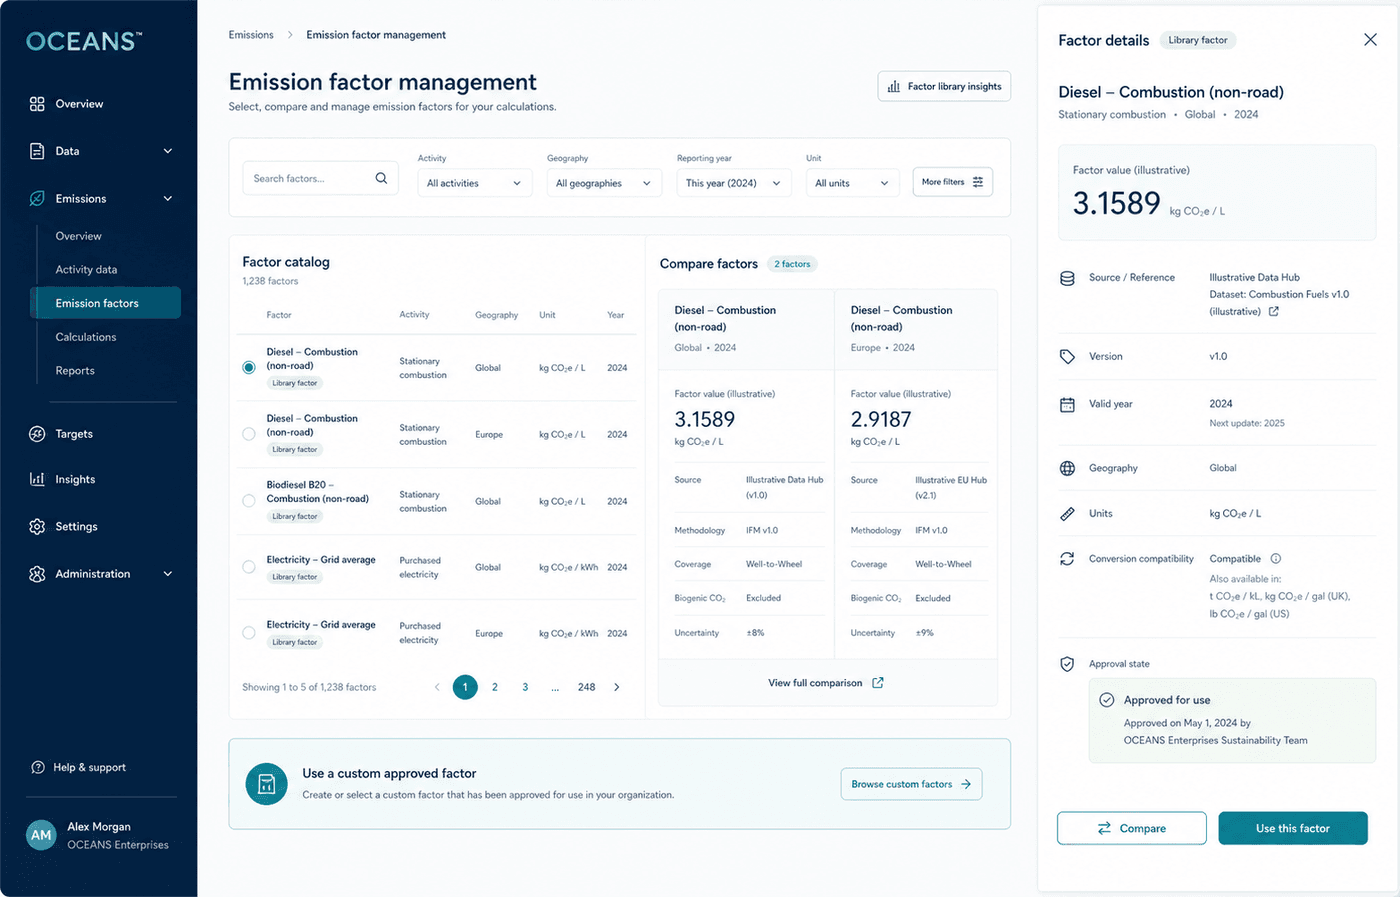
The quality of an emissions calculation depends on the relevance and transparency of the emission factors behind it. OCEANS™ Sustainability is designed to keep the source, geography, unit, reporting period, and version of every factor visible alongside the calculations that use it.
- Factor source and publication year
- Geography and applicable activity
- Unit of measure
- Reporting period the factor applies to
- Factor version, preserved as versions change
- Approval status for custom or supplier-specific factors
SB 253 CALCULATION CONTROL
What makes an SB 253 emissions calculation defensible?
A defensible SB 253 calculation needs more than a Scope total. The reporting entity must apply a documented boundary and method, use appropriate activity data and emissions factors, preserve material assumptions, and maintain information that can support review and phased assurance requirements.
- 01
Organizational boundary
Show which entities and facilities are included and how consolidation decisions were made.
- 02
Operational boundary
Identify the emissions sources and Scope 3 categories included, estimated or excluded.
- 03
Reporting period
Align operational records, factor vintages and calculations with the applicable reporting year.
- 04
Scope 2 method
Keep location-based and market-based calculations, contractual instruments and assumptions distinguishable where applicable.
- 05
Factor governance
Retain the factor source, geography, activity, unit, publication year, version and approval status.
- 06
Data hierarchy
Distinguish directly measured, physical activity, supplier-specific, secondary, spend-based and proxy information.
- 07
Change control
Record changes to data, factors, methods and organizational structure and identify affected results.
- 08
Assurance preparation
Keep source records, calculation workpapers, assumptions, approvals and exceptions organized for an external review.
OCEANS™ turns each requirement into visible calculation context instead of leaving it inside a spreadsheet formula or an analyst's inbox.
Move from spend estimates toward better Scope 3 data
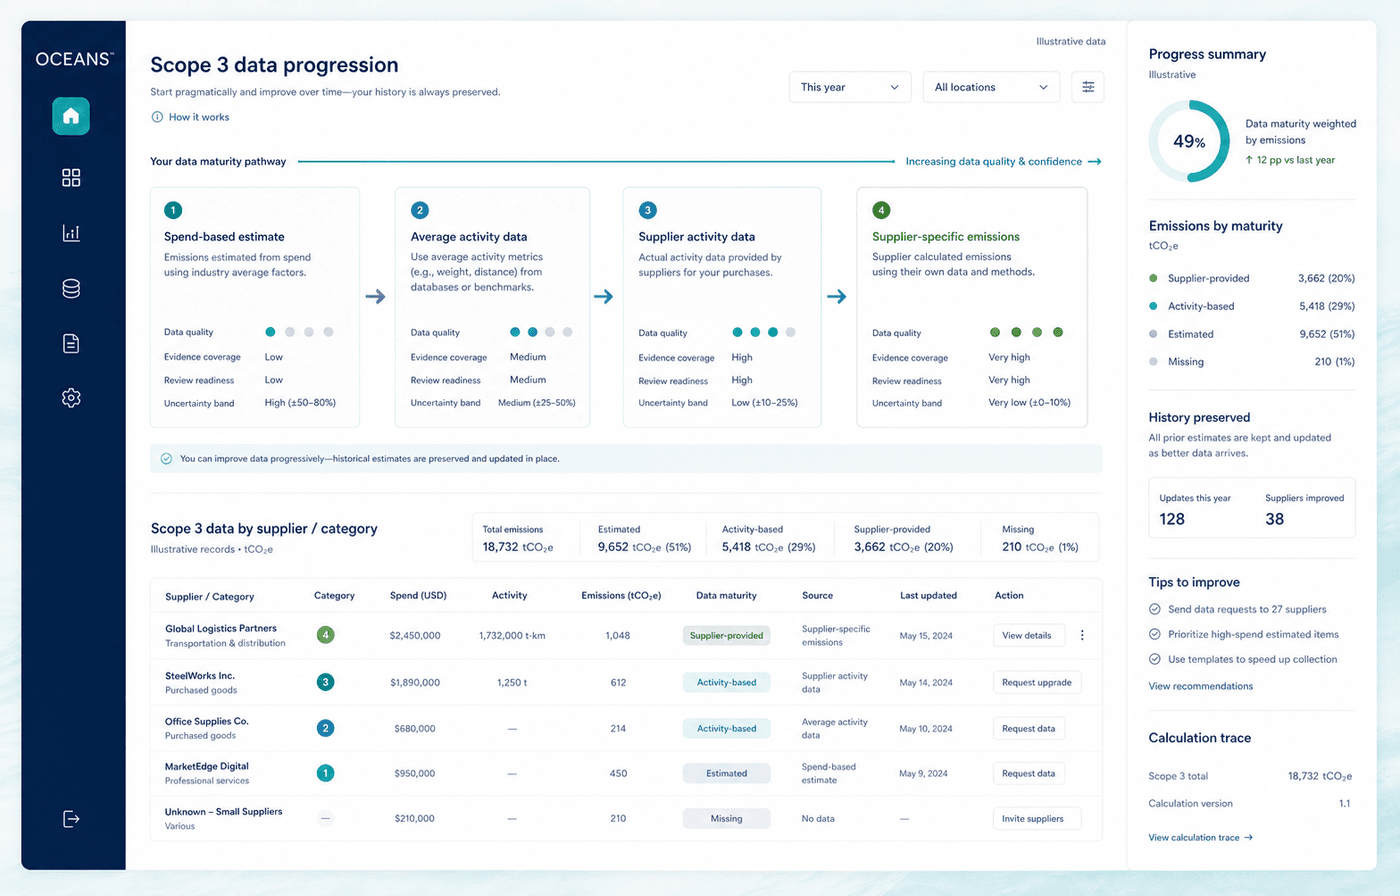
Scope 3 accounting often begins with limited information. OCEANS™ Sustainability helps you start with available data, document the calculation method, and improve accuracy as better activity or supplier-specific data becomes available—without presenting estimates as perfect measurements.
- 1
Spend-based estimate
Emissions estimated from spend using industry-average factors.
- 2
Average activity data
Activity metrics such as weight or distance from external benchmarks.
- 3
Supplier activity data
Actual activity data provided directly by suppliers for your purchases.
- 4
Supplier-specific emissions data
Emissions calculated by a supplier using their own data and methods.
SCOPE 3 FROM 2027
How can manufacturers prepare for SB 253 Scope 3 reporting?
CARB has been developing its approach to Scope 3 reporting beginning in 2027. Manufacturers can prepare without guessing the final rule by building a category map, supplier register, calculation-method record and evidence trail that can adapt as requirements are finalized. See the Scope 3 supplier-data workflow for the full collection process.
- 1
Screen relevant categories
Map purchasing, capital goods, fuel- and energy-related activity, logistics, waste, travel, commuting, product use and other relevant value-chain activity.
- 2
Prioritize material data gaps
Identify the suppliers, categories and estimates that contribute most to the footprint or create the greatest uncertainty.
- 3
Document the calculation method
Preserve whether the result uses spend, average activity, supplier activity or supplier-specific emissions data.
- 4
Review supplier information
Capture the supplier boundary, period, allocation method, factors, exclusions, supporting evidence and verification status.
- 5
Improve the inventory over time
Replace material estimates with more specific activity or supplier data without losing the prior method and calculation history.
Rulemaking status: CARB discussed proposed Scope 3 approaches during its March and July 2026 workshops. The final scope, timing and detailed requirements may change. This page was reviewed on September 13, 2026; confirm current CARB materials before relying on an implementation detail.
Make uncertainty visible—and preserve what changed
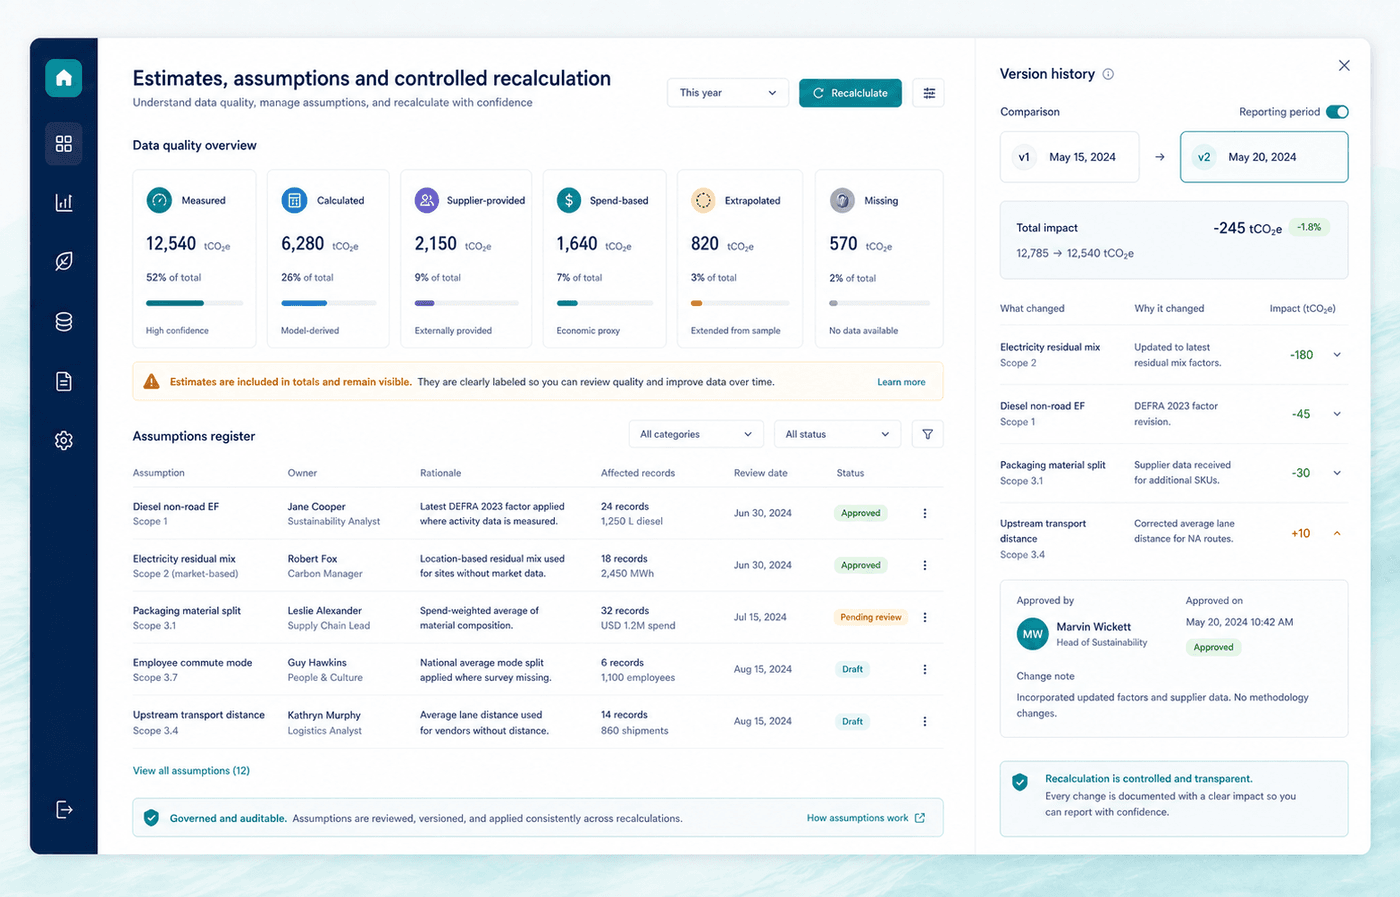
Not every organization begins with complete primary data. OCEANS™ Sustainability helps teams document estimates, assumptions, exclusions, and data gaps alongside their calculations, distinguishing between:
- Measured activity data
- Calculated values
- Supplier-provided information
- Spend-based estimates
- Extrapolated values
- Missing or excluded information
The objective is not to hide uncertainty. It is to understand it and improve the underlying data over time. Organizational structures, activity data, and methodologies can change between reporting periods — keeping a record of what changed and why helps your team maintain a consistent process as the inventory evolves.
Move from calculating emissions to understanding them
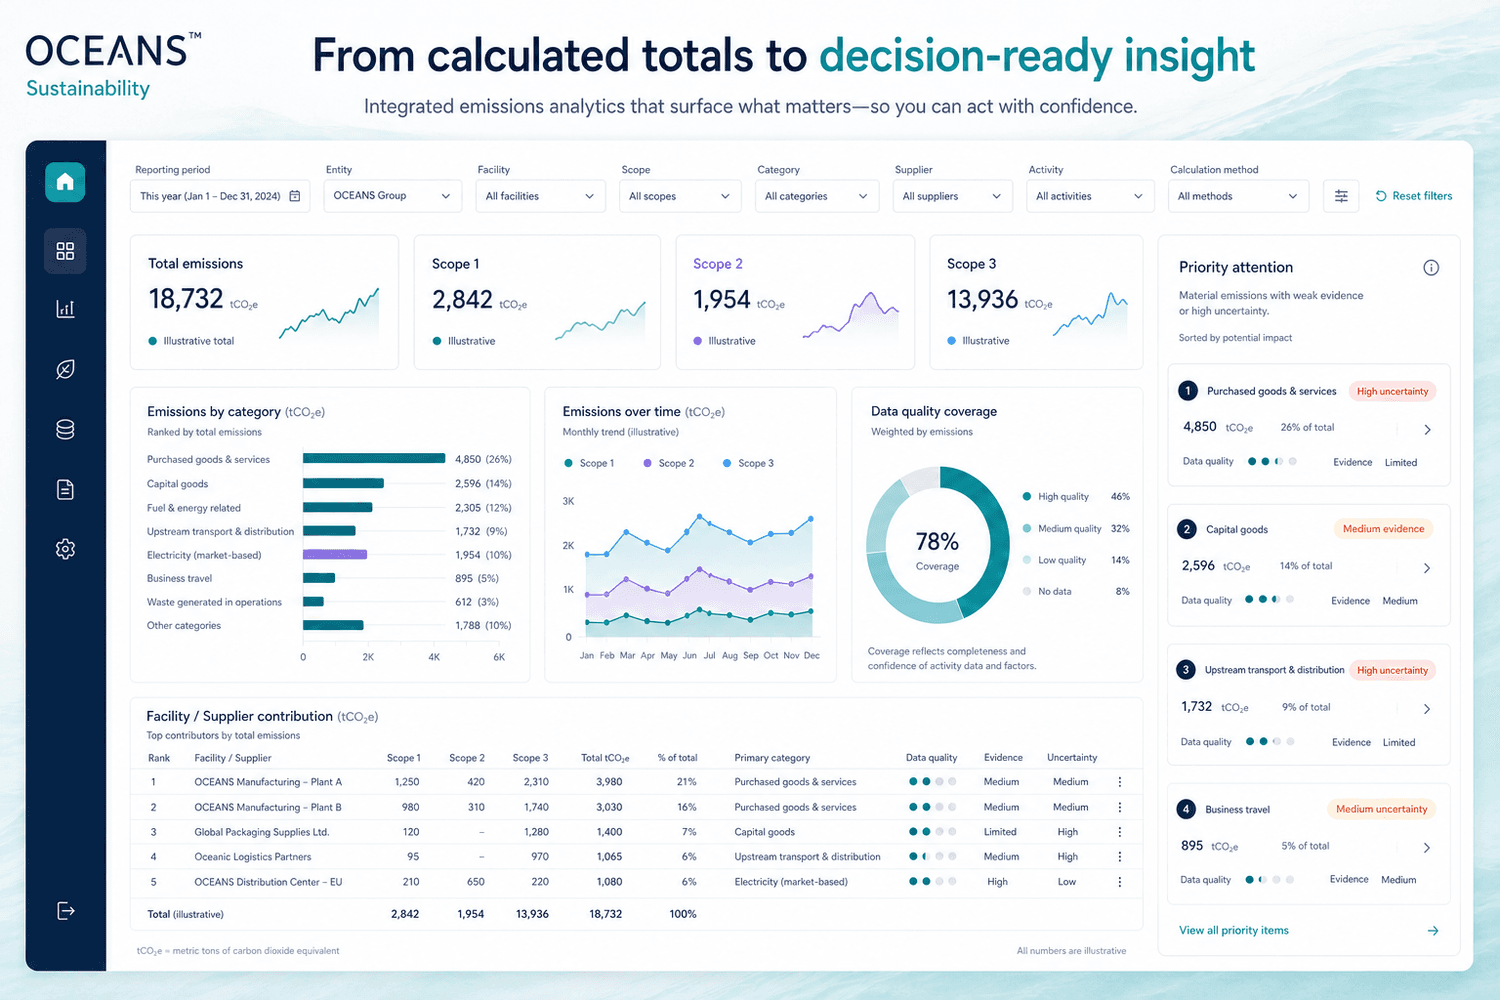
Once calculations are complete, explore your emissions inventory across the dimensions that matter to your business:
- Scope and category
- Entity and business unit
- Facility and geography
- Supplier or purchasing category
- Activity type
- Reporting period
- Data source or calculation method
Identify hotspots
Understand which activities contribute most to your footprint.
Monitor change
Compare emissions across reporting periods.
Prioritize improvements
Focus data-quality effort on the categories that carry the most weight.
Support reporting
Reuse reviewed calculations across stakeholder requirements.
FROM EMISSIONS TO FINANCIAL RISK
How can emissions data support an SB 261 climate-risk assessment?
Emissions data does not complete an SB 261 disclosure by itself. It can reveal operational dependencies and transition exposure that management may need to examine alongside physical hazards, financial information, strategy and governance.
Energy and fuel exposure
Identify facilities and processes dependent on emissions-intensive fuels or electricity and provide consistent activity trends for cost and transition analysis.
Supplier and logistics exposure
Locate value-chain categories and suppliers that may be sensitive to policy, customer, technology or transportation changes.
Data limitations
Show where conclusions depend on estimates, incomplete boundaries or missing supplier information so decision-makers can judge uncertainty.
Reduction decisions
Connect proposed operational or supplier actions to the emissions sources they address, while management evaluates cost, feasibility and financial effect.
OCEANS™ provides traceable emissions evidence for the analysis. It does not decide legal applicability, materiality, financial impact, governance responsibility or the content of the final SB 261 disclosure.
SB 261 status: Enforcement has been affected by litigation. CARB stated that it would not enforce failure to meet the January 1, 2026 statutory deadline while the Ninth Circuit injunction remained in effect. Regulatory development may continue. Check the latest CARB and court information before acting.
What can an OCEANS™ California climate-reporting workspace contain?
- Organizational and operational boundary record
- Scope 1, Scope 2 and Scope 3 inventory
- Location-based and market-based Scope 2 calculations where applicable
- Activity-data and source-document register
- Emissions-factor register with versions and geography
- Scope 3 category and supplier-method map
- Assumptions, estimates, exclusions and limitations log
- Data-quality and missing-information view
- Calculation change history
- Contributor, reviewer and approval status
- Evidence package for internal review or independent assurance
- Emissions trends and hotspots for climate-risk discussions
The exact reporting and disclosure obligations depend on the reporting entity, current rules and professional advice. OCEANS™ organizes the carbon data and evidence so the responsible teams can work from a consistent foundation. See carbon-data quality and traceability, emissions-factor governance, and evidence verification for the underlying workflows. Manufacturers responding to a customer sustainability questionnaire alongside SB 253/261 preparation can also see the EcoVadis and OEM questionnaire response sprint.
Sources and regulatory status
Regulatory information on this page was reviewed on September 13, 2026. CARB rulemaking and litigation can change deadlines, coverage and implementation details. Confirm current official materials and obtain professional advice for your circumstances.
- CARB program overview (opens in a new tab, external site)
- CARB climate-disclosure meetings and workshops (opens in a new tab, external site)
- CARB corporate climate-reporting resources (opens in a new tab, external site)
- CARB SB 261 docket and enforcement status (opens in a new tab, external site)
- GHG Protocol Corporate Standard (opens in a new tab, external site)
- GHG Protocol Scope 2 Guidance (opens in a new tab, external site)
- GHG Protocol Scope 3 Standard (opens in a new tab, external site)
Methodology
Built around recognized carbon-accounting concepts
OCEANS™ Sustainability is designed to structure emissions data and calculations around established greenhouse-gas accounting concepts, including organizational boundaries, emissions scopes, activity data, emission factors, and documented calculation methods. Our methodology explains:
- How organizational boundaries are established
- How emissions sources are categorized
- How calculation methods are selected
- How emission factors are managed
- How estimates and exclusions are documented
- How calculation changes are preserved
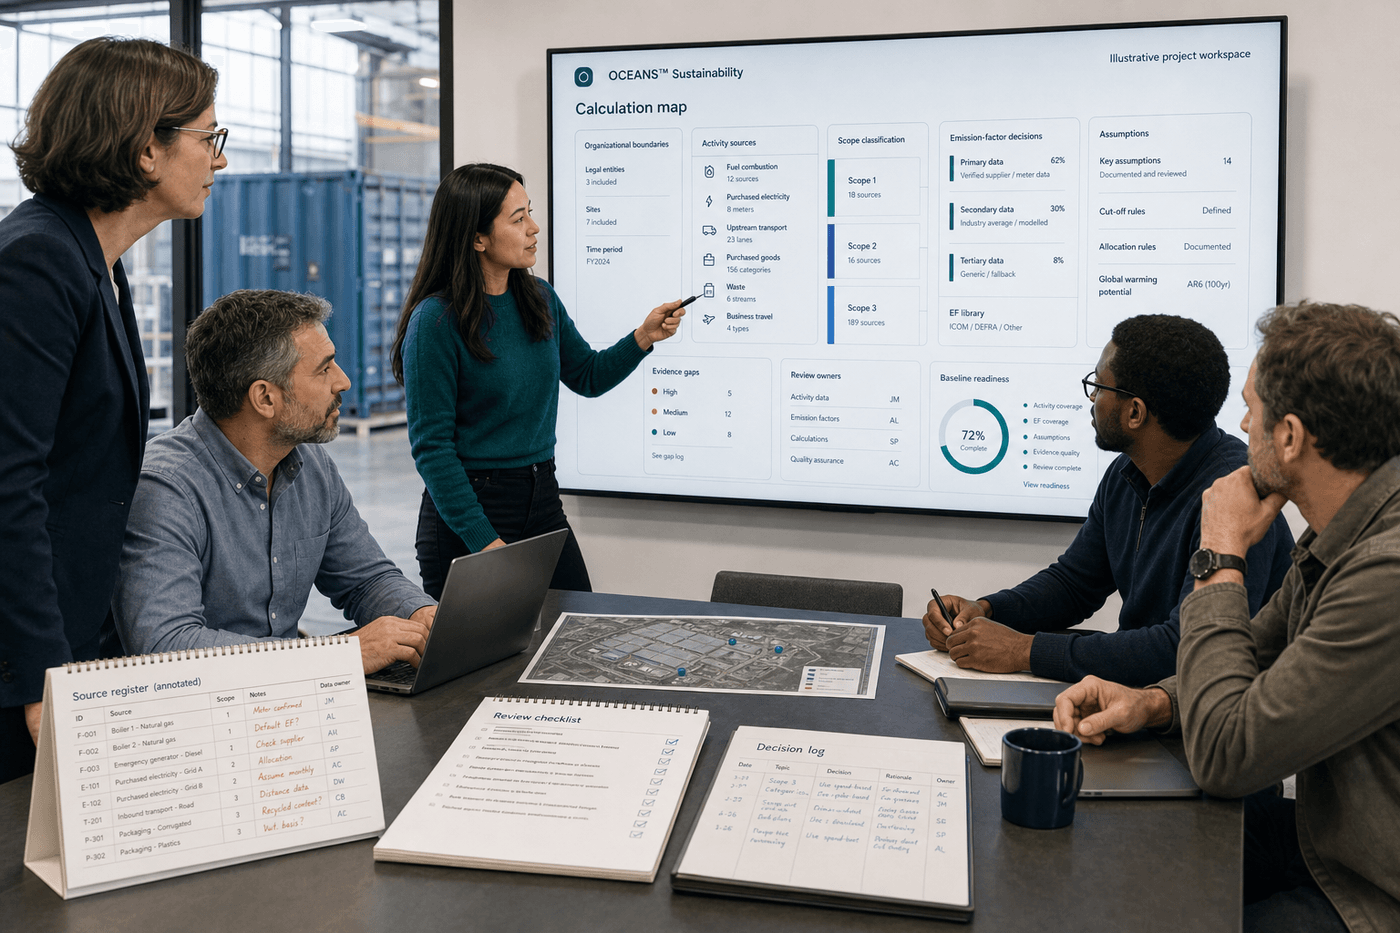
Carbon accounting software—with practical guidance
Selecting boundaries, identifying relevant emissions sources, and choosing calculation methods can be challenging for lean teams. OCEANS™ Sustainability is designed to combine software with guided implementation to help your team establish a practical calculation process using the information currently available.
Discuss your emissions baseline- 01
Define your reporting objective
- 02
Establish organizational and operational boundaries
- 03
Identify material emissions sources
- 04
Select appropriate calculation approaches
- 05
Review data gaps and assumptions
- 06
Finalize the emissions baseline
See whether your emissions data is ready for California scrutiny
Bring one facility, one reporting period and the calculation you use today. The OCEANS™ founder will show how the same result can be connected to its source data, factor version, assumptions and review history—and where gaps may affect SB 253 reporting or SB 261 risk analysis.
Questions
Frequently asked questions.
What is the difference between Scope 1, 2, and 3?
Scope 1 covers direct emissions from sources your company owns or controls. Scope 2 covers emissions from purchased electricity, steam, heating, and cooling. Scope 3 covers relevant emissions across your upstream and downstream value chain, including purchased goods and supplier activity.
Do I need activity data for every source before I can calculate anything?
No. A calculation can start with the data you have and document estimates or gaps explicitly, rather than waiting for complete records across every category.
How are emission factors chosen and documented?
Each calculation is designed to record the method, the specific factor applied, and any assumptions behind it — so a result can be explained rather than treated as a black box.
Can a calculation change after it is first recorded?
Yes — as better data or a corrected factor becomes available, a result can be revised, with the prior version and reason for the change preserved rather than silently overwritten.
What is California SB 253?
California SB 253 is the Climate Corporate Data Accountability Act. It requires covered companies doing business in California to report Scope 1, Scope 2 and Scope 3 greenhouse-gas emissions according to the applicable timetable and requirements developed by CARB.
What is California SB 261?
California SB 261 is the Climate-Related Financial Risk Reporting Program. It concerns biennial public disclosure of climate-related financial risk and the measures adopted to reduce or adapt to that risk. Its enforcement status has been affected by litigation, so companies should check current CARB and court updates.
What is the difference between SB 253 and SB 261?
SB 253 focuses on greenhouse-gas emissions measurement, reporting and assurance. SB 261 focuses on climate-related financial risk, strategy, governance and management judgment. Traceable emissions data can support both processes, but it does not replace the broader financial-risk work required for SB 261.
How does OCEANS™ Sustainability support SB 253?
OCEANS™ connects Scope 1, Scope 2 and Scope 3 calculations to activity data, source documents, emissions factors, assumptions, data-quality context and review history. This helps U.S. manufacturers prepare consistent emissions information and evidence for reporting and external assurance.
How does OCEANS™ Sustainability support SB 261?
OCEANS™ provides emissions trends, operational hotspots, supplier exposure and documented data limitations that can inform climate-related financial-risk analysis. Management, finance, legal advisers and the board remain responsible for judgments, governance and the final disclosure.
Does OCEANS™ determine whether a company must report under SB 253 or SB 261?
No. Coverage depends on the statutes, current regulations, the company's structure, revenue and California business activity. OCEANS™ supports the data and calculation process; companies should confirm legal applicability with qualified counsel and current CARB guidance.
Can OCEANS™ prepare emissions information for SB 253 assurance?
OCEANS™ organizes source records, calculation methods, factor references, assumptions, change history and review status so information can be prepared for independent assurance. The assurance engagement and opinion are performed by an eligible external provider.
When does SB 253 Scope 3 reporting begin?
The statute provides for Scope 3 reporting beginning in 2027, with detailed implementation being developed by CARB. Companies should confirm the latest reporting period, deadline, category and methodology requirements in current CARB materials.
Do mid-market manufacturers need to care about SB 253 and SB 261?
Even when a manufacturer is below a direct statutory revenue threshold, covered customers may request energy, emissions or supplier information for their own reporting and risk-management processes. A reusable, source-linked inventory helps the manufacturer respond consistently.
What is OCEANS™ Sustainability?
OCEANS™ Sustainability is AI-assisted carbon-accounting software built for growing U.S. manufacturers. It connects operational and supplier data with Scope 1, Scope 2 and Scope 3 calculations, emissions factors, assumptions, source evidence and human review.
Current availability
OCEANS™ Sustainability is in active product development. Access is currently limited to founding design partners — the workflow, screens, and outcomes described on this page are the design in progress, and any product screens shown are an illustrative preview of planned functionality. Guides, checklists, and the calculator elsewhere on this site are real and available now. Apply as a founding design partner to help test and shape this workflow as it is built.
Build an emissions inventory you can understand and repeat
See how OCEANS™ Sustainability is designed to connect activity data, emission factors, assumptions, evidence, and reported results in one transparent calculation workflow.