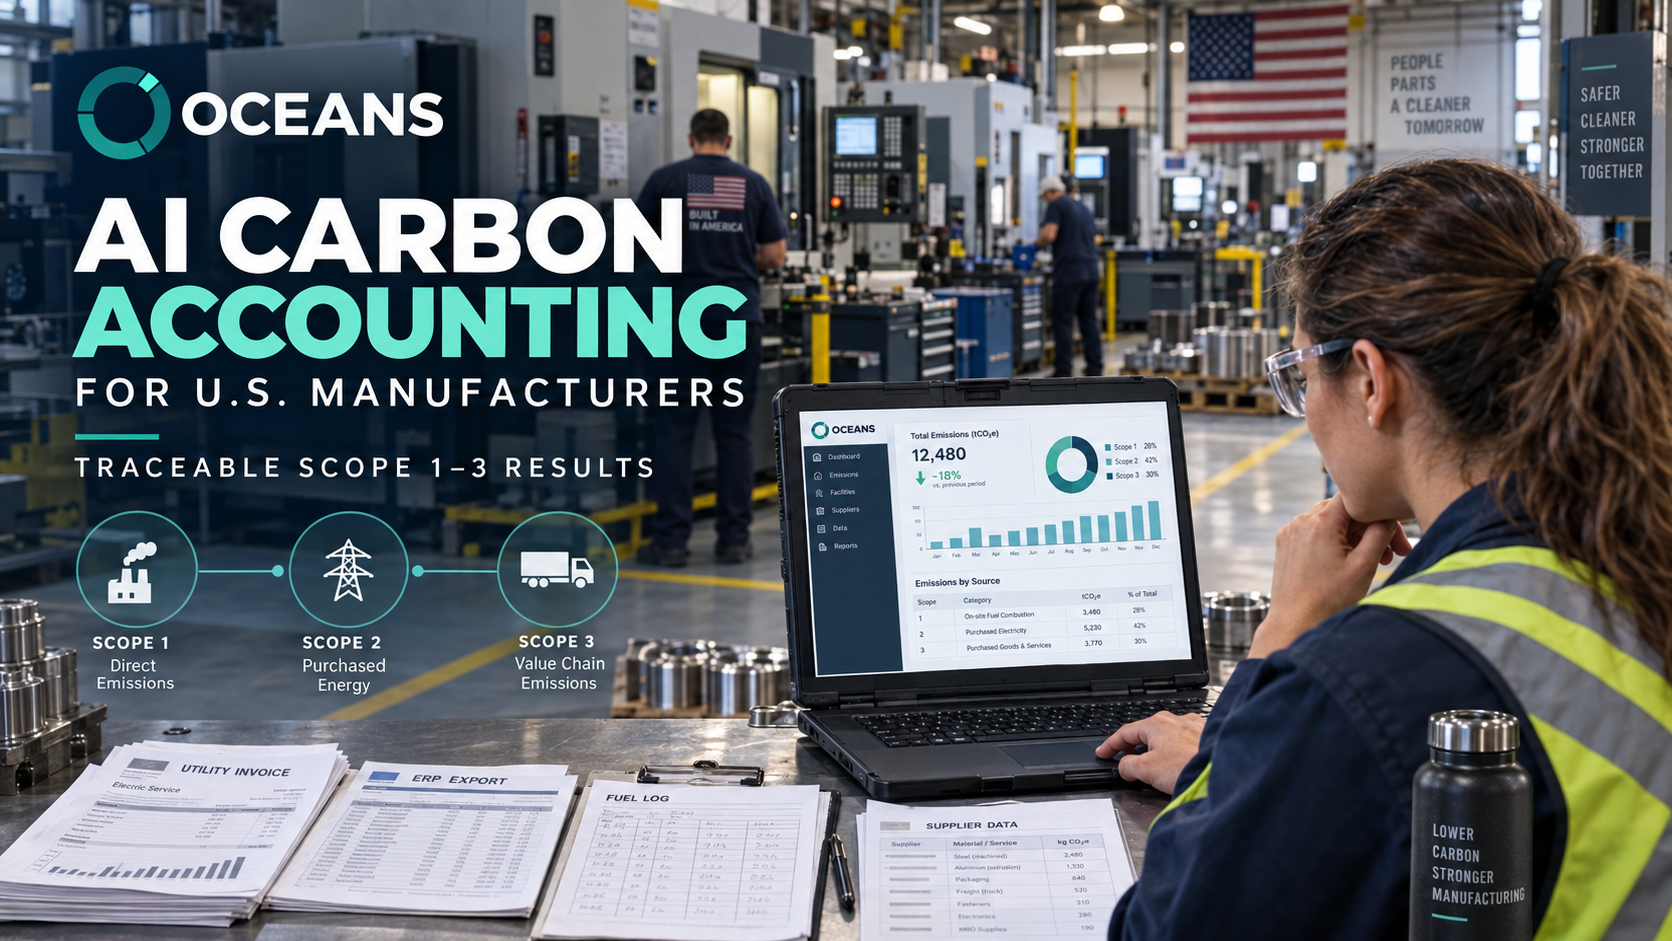
A manufacturer does not begin carbon accounting with a clean emissions dataset. It begins with electricity bills in Facilities, fuel records in Plant Operations, purchasing transactions in the ERP, refrigerant logs in EHS and incomplete answers from suppliers.
AI can help organize that information. It can extract consumption values, classify transactions, identify missing periods, suggest mappings and draft explanations. But AI does not make a carbon result credible by itself.
The short answer: AI carbon accounting for U.S. manufacturers turns operational records into Scope 1, Scope 2 and Scope 3 results by extracting activity data, standardizing units, classifying emissions sources and assisting with factor matching. A traceable result must still preserve the original source, reporting boundary, calculation method, emission factor, assumption, version and human reviewer behind every number.
That distinction separates useful automation from a black box.
What is AI carbon accounting?
AI carbon accounting is the use of machine learning and generative AI to assist with emissions-data work such as document extraction, transaction classification, anomaly detection, data-gap identification, factor suggestions, supplier engagement and report drafting.
The underlying accounting remains a controlled calculation:
Activity data × applicable emission factor = greenhouse-gas emissions
For example, an electricity bill may provide kilowatt-hours. A U.S. electricity factor may come from EPA's Emissions & Generation Resource Integrated Database, commonly called eGRID. EPA publishes generation and emissions information at several geographic levels, including eGRID subregions.[^1]
AI can locate the consumption value and service address. It should not silently decide that a national factor is appropriate, ignore the reporting year or erase the connection to the original invoice.
What manufacturing data feeds Scope 1, Scope 2 and Scope 3?
Manufacturing emissions sit across systems created for operations, purchasing and financial control rather than carbon reporting.
| Manufacturing record | Typical owner | Carbon-accounting use | Common data problem |
|---|---|---|---|
| Natural-gas and stationary-fuel records | Facilities or Plant Operations | Scope 1 combustion | Mixed units, missing months or cost without quantity |
| Fleet and mobile-equipment fuel logs | Fleet or Operations | Scope 1 mobile combustion | Vehicle ownership, fuel type and on-road/off-road use are unclear |
| Refrigerant service records | EHS or Maintenance | Scope 1 fugitive emissions | Refrigerant type or quantity added is missing |
| Electricity bills and meter exports | Facilities or Finance | Scope 2 purchased electricity | Billing periods cross months; facility and meter mappings differ |
| ERP and accounts-payable transactions | Finance or Procurement | Scope 3 screening and categorization | Descriptions are inconsistent and quantities may be absent |
| Bills of materials and production records | Engineering or Operations | Product and activity-based Scope 3 | Part revisions, scrap and yields change over time |
| Freight and logistics records | Logistics or Procurement | Scope 3 transportation | Distance, weight, mode or responsibility is incomplete |
| Supplier submissions | Procurement or Sustainability | Supplier-specific Scope 3 | Boundary, method, allocation and verification status vary |
GHG Protocol provides calculation guidance for all 15 Scope 3 categories and recognizes multiple methods, including supplier-specific, hybrid, average-data and spend-based approaches.[^2] The method should follow the available data and intended use of the result.
How does ERP data become a Scope 3 result?
An ERP contains valuable purchasing evidence, but a dollar amount is not a physical emissions measurement. It is a starting point.
Consider a fictional Ohio components manufacturer with this purchasing line:
Supplier: AlloySource | Description: AL 6061 extrusion | Quantity: 18,400 kg | Spend: $72,300 | Plant: OH-02 | Date: 2025-04-18
A controlled AI-assisted workflow can process the record in stages:
- Preserve the transaction. Retain the supplier, description, quantity, unit, amount, currency, location, date and source-file reference.
- Classify the activity. Map the purchase to the relevant Scope 3 category and material family while retaining the original text.
- Check data quality. Determine whether a physical quantity, supplier-specific footprint or only financial spend is available.
- Select a calculation method. Use the best supported method for the stated purpose. A screening estimate and a supplier-specific result should be labelled differently.
- Match an emission factor. Record the factor source, dataset version, geography, unit, boundary and any conversion.
- Calculate and review. Show the formula, result, assumptions and confidence or data-quality status to a qualified reviewer.
- Preserve lineage. Link the result back to the ERP row, mapping decision, factor and reviewer action.
If the supplier later provides a credible product carbon footprint, the manufacturer may replace a broad estimate with more specific data. The prior result should remain in the version history so the change can be explained.
This progression matters. GHG Protocol guidance gives priority to more product-specific information where it is available and sufficiently reliable, while less specific sources may require estimation or allocation.[^2]
How do utility bills become Scope 1 and Scope 2 results?
AI document extraction can reduce the work of reading hundreds of utility invoices. The system may identify account number, service address, billing dates, consumption, demand, unit and cost.
The next steps require controls:
- Match the service address and meter to the correct facility.
- Detect duplicate bills, rebills, credits and missing periods.
- Separate consumption from cost.
- Normalize therms, MMBtu, gallons, litres and kilowatt-hours without losing the original unit.
- Assign activity to the correct reporting period.
- Apply the documented factor source and version.
- Preserve both the bill and the calculation record.
A utility line reading $31,850 electricity expense is not equivalent to a bill showing 420,000 kWh. Financial spend may help identify the vendor or locate missing records, but activity-based electricity calculations normally require consumption data.
For U.S. location-based electricity calculations, EPA eGRID is a common source. The correct geographic level and data vintage should be documented rather than selected invisibly.[^1]
How should supplier data improve Scope 3?
Supplier data is valuable only when the manufacturer understands what the number represents.
A supplier submission should ideally state:
- The reporting entity, facility or product covered
- The reporting period
- The organizational and lifecycle boundary
- The emissions scopes included
- The calculation method and factor sources
- The allocation method, if applicable
- Whether the value is measured, calculated or estimated
- Whether independent assurance or verification was performed
- Known exclusions and limitations
AI can read submissions, flag missing fields and compare units. It can help procurement teams prioritize suppliers whose data could materially change the inventory. Human review is still needed to decide whether the submission is comparable, sufficiently specific and appropriate for the intended calculation.
Collecting every possible field from every supplier is rarely efficient. A better sequence is to screen the portfolio, identify emissions hotspots and concentrate engagement on suppliers and data gaps that can change a decision.
What can AI automate, and what must a human control?
| AI can assist with | A human should control |
|---|---|
| Extracting values from authorized invoices and records | Defining organizational and operational boundaries |
| Standardizing names, dates and units | Approving the reporting period and consolidation approach |
| Classifying transactions into candidate categories | Resolving ambiguous or material classifications |
| Suggesting factor matches | Approving factor source, geography, vintage and applicability |
| Detecting duplicates, gaps and unusual values | Deciding whether an anomaly is an error or a real operational event |
| Drafting supplier questions and methodology notes | Approving what is requested, disclosed and represented to customers |
| Summarizing calculations and limitations | Signing off on the final inventory and material judgments |
The practical rule is simple: AI may propose; the controlled record must show what was accepted, changed or rejected, by whom and why.
What makes a Scope 1–3 result traceable?
A traceable carbon result answers seven questions:
- Source: Which bill, log, ERP row or supplier document supplied the input?
- Boundary: Which entity, facility, activity, product and period does it cover?
- Method: Which calculation approach was used?
- Factor: Which factor, dataset version, geography and unit were applied?
- Assumption: What was estimated, allocated, converted or excluded?
- Version: What changed since the previous result?
- Review: Who reviewed the calculation, and when?
This record supports internal review, customer questions and preparation for assurance. Software can organize the evidence and workflow; it does not itself provide independent assurance.
How do carbon-accounting platforms serving the U.S. market differ?
The U.S. market includes broad enterprise suites, specialist carbon platforms and tools aimed at smaller teams. The right fit depends on company scale, existing systems, reporting requirements, supplier complexity and internal expertise.
The following summary describes public vendor positioning as of September 16, 2026. It is not an independent product ranking. Buyers should verify current capabilities, implementation requirements, pricing, security and contractual commitments directly with each provider.
| Platform | Publicly emphasized strength | Likely evaluation context |
|---|---|---|
| OCEANS Sustainability | AI-assisted carbon accounting for growing U.S. manufacturers, connecting operational records, Scope 1–3 calculations, supplier evidence and reduction decisions | Lean manufacturing teams that want a focused, founder-led workflow around traceability and customer requests |
| IBM Envizi | High-volume ERP and order-line data, supplier engagement, and Scope 3 Categories 1 and 2 at enterprise scale[^3] | Large organizations with complex procurement systems and broad ESG programs |
| Microsoft Sustainability Manager | Extensible sustainability data model, business-system integrations, calculation models, reporting and Microsoft cloud tooling[^4] | Organizations already invested in Azure, Dynamics 365, Power Platform or Microsoft data architecture |
| Watershed | Enterprise sustainability AI, extensive emissions-factor data, product footprints, disclosure and decarbonization workflows[^5] | Large or complex companies seeking a broad global platform and product-level modelling |
| Persefoni | AI-assisted carbon accounting, anomaly detection, factor mapping, enterprise footprints and supplier engagement[^6] | Enterprises and financial organizations needing sophisticated carbon and disclosure capabilities |
| Sweep | Centralized sustainability data, collaborative workflows, supplier engagement and multi-framework reporting[^7] | Organizations coordinating sustainability data across many entities and value-chain participants |
| Greenly | Carbon management for companies from SMB to enterprise, with supplier engagement, factor libraries and advisory support[^8] | Teams seeking a packaged platform-and-expert model across multiple maturity levels |
| CarbonTool | Scope 1–3 measurement, supplier portal, reporting, decarbonization planning and published pricing[^9] | Smaller and mid-market teams comparing accessible self-service and expert-supported options |
OCEANS Sustainability has a specific place in this market. It is designed around how growing U.S. manufacturers actually receive and defend carbon information: through utility bills, fuel logs, procurement exports, supplier files and customer questionnaires. Its role is to connect those records to calculation logic and practical reduction decisions without hiding the evidence chain.
How should a manufacturer evaluate AI carbon-accounting software?
Bring a real, messy sample to the evaluation: one utility PDF, one fuel log, one ERP export and one supplier submission. Then ask each vendor to demonstrate the following:
- Can the system preserve the original file and row-level source?
- Can a user see why a transaction was classified into a Scope 3 category?
- Does factor matching show the source, version, geography and units?
- Can a reviewer override an AI suggestion and record the reason?
- How are duplicates, missing months and unit conflicts surfaced?
- Can estimates be distinguished from primary supplier data?
- Does version history explain why a result changed?
- Can the same controlled data support a customer questionnaire and an inventory?
- What integrations work today, and which require implementation work?
- What security, access-control, retention and data-location commitments are contractual?
The most impressive dashboard is less important than the system’s behavior when the input is incomplete, inconsistent or ambiguous.
What is the OCEANS approach to AI carbon accounting?
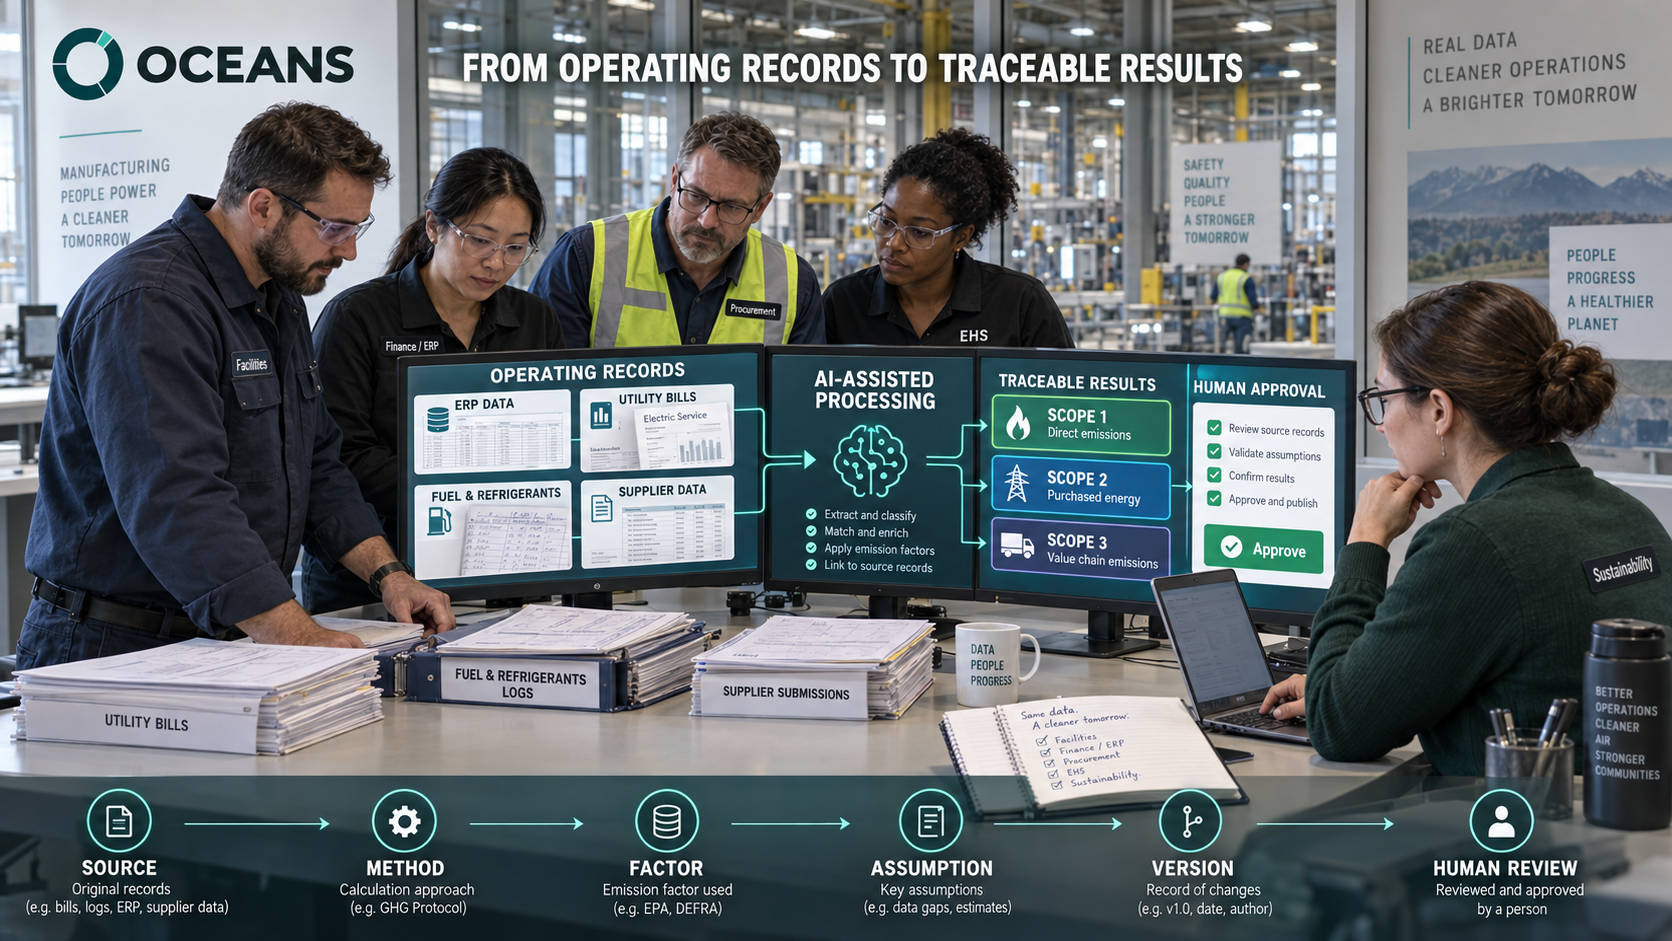
OCEANS Sustainability is an AI-assisted carbon accounting platform built for growing U.S. manufacturers. It is designed to connect operational data, emissions calculations, supplier information, supporting evidence and reduction planning in one traceable workflow.
AI assists with labor-intensive steps such as extracting authorized records, classifying transactions, identifying gaps, organizing supplier data and preparing explanations. The calculation record keeps the source, method, factor and assumptions visible for human review.
That approach gives a manufacturing team more than a total. It gives them a result they can investigate, explain, improve and reuse.
Carbon accounting you can trace. Decisions you can defend.
If your team is trying to turn ERP exports, utility bills or supplier records into credible Scope 1–3 results, talk to the OCEANS founder.
Frequently asked questions
Can AI calculate Scope 1, Scope 2 and Scope 3 emissions?
AI can assist with extracting, classifying, standardizing and checking the data used in Scope 1–3 calculations. The result still depends on correct boundaries, methods, emission factors, assumptions and human review.
Can an ERP calculate a manufacturer’s carbon footprint?
An ERP can supply purchasing, supplier, quantity, cost and location data. That information must be mapped to applicable emissions categories and methods. Utility, fuel, refrigerant, production and supplier records may also be required.
Is spend-based Scope 3 data sufficient?
Spend-based data is useful for screening and prioritization. It may be refined with physical activity, product or supplier-specific information when greater specificity is material and available.
What is source-linked carbon accounting?
Source-linked carbon accounting connects each result to its original operational record, calculation method, factor, assumptions, version and reviewer. This makes the number easier to explain and update.
Does AI make a carbon inventory audit-ready?
AI can help organize evidence, detect gaps and support review workflows. Independent assurance depends on the applicable criteria, evidence, controls, practitioner and engagement scope. A software output alone is not assurance.
Which carbon-accounting software is best for a U.S. manufacturer?
The answer depends on the manufacturer’s size, systems, reporting obligations, supplier network and internal team. OCEANS Sustainability is specifically designed for growing U.S. manufacturers that need operational evidence, Scope 1–3 calculations, supplier-data workflows and practical reduction decisions connected in one system.
Sources
[^1]: U.S. Environmental Protection Agency, Frequent Questions About eGRID, accessed September 16, 2026. [^2]: GHG Protocol, Scope 3 Calculation Guidance, accessed September 16, 2026. [^3]: IBM, Envizi Supply Chain Intelligence overview, accessed September 16, 2026. [^4]: Microsoft Learn, Microsoft Sustainability Manager overview, accessed September 16, 2026. [^5]: Watershed, The Enterprise Platform for Emissions Measurement and Sustainability Disclosure, accessed September 16, 2026. [^6]: Persefoni, Carbon Accounting and Sustainability Management Platform, accessed September 16, 2026. [^7]: Sweep, Sustainability and Carbon Management Platform, accessed September 16, 2026. [^8]: Greenly, Sustainable Procurement Through Supplier Engagement, accessed September 16, 2026. [^9]: CarbonTool, Carbon Accounting and Sustainability Platform, accessed September 16, 2026.
Sai Praneeth, Founder of OCEANS Sustainability Platform
OCEANS™ Sustainability
OCEANS™ Sustainability is carbon-accounting software for growing US manufacturers, a product of TheEvenity Pvt Limited. The Founding Design Partner Program is now open.